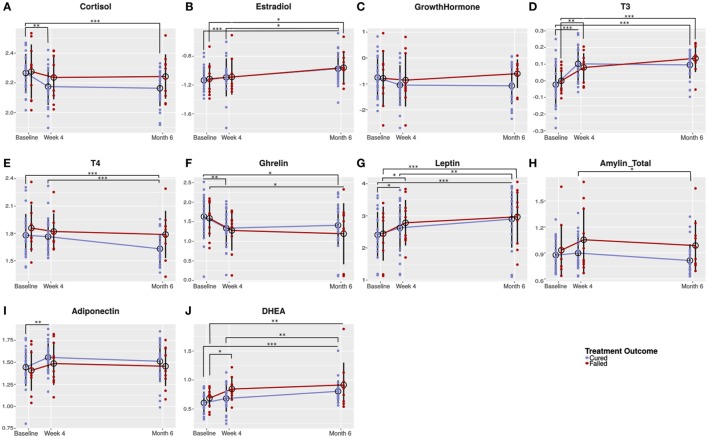
Figure 2.
Changes in circulating hormone concentrations during the course of tuberculosis (TB) treatment. Plasma from TB patients (males and females) who were cured (n = 25) and who failed (n = 10) TB treatment were collected before (baseline) and during TB treatment (week 4 and month 6). Plasma collected was subjected to hormone measurement by Luminex analysis [cortisol (A), T3 (D), T4 (E), ghrelin (F), leptin (G), and estradiol (B)] and ELISA [dehydroepiandrosterone (DHEA) (J), amylin (Tot) (H), adiponectin (I), and growth hormone (C)]. Data were analyzed by a linear mixed-effects model of hormone concentrations by treatment outcome and time point as fixed effects and patient ID as random effect. Results are presented as means of the log-transformed data with SD. A p-value of < 0.05 was regarded as significantly different. *p-value < 0.05; **p-value < 0.01; ***p-value < 0.001.

