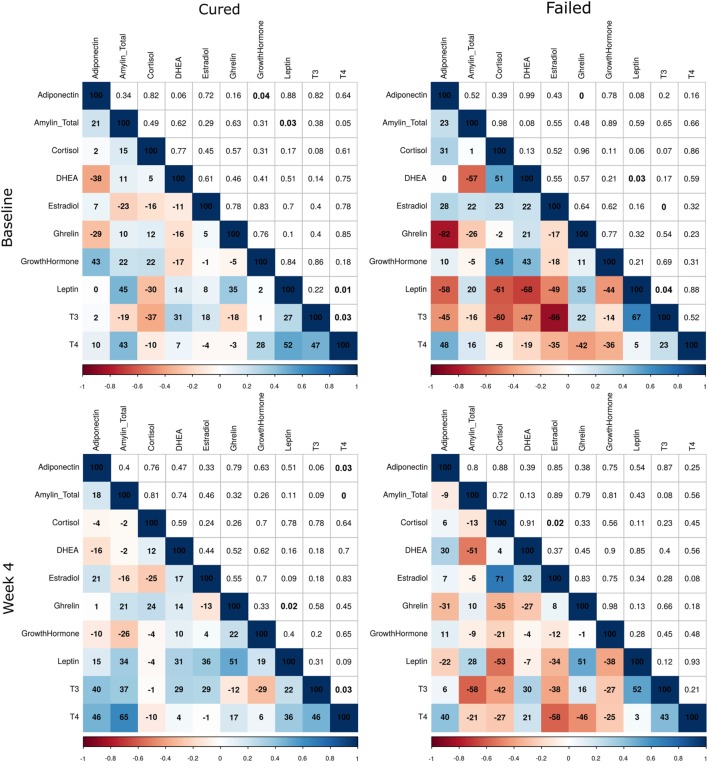
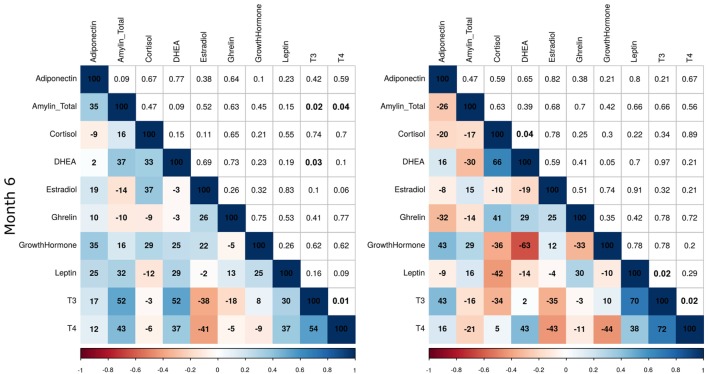
Figure 3.
Correlations between plasma hormone concentrations of tuberculosis patients who were cured and who failed treatment at baseline, week 4, and month 6. Hormone concentrations were measured by Luminex analysis (cortisol, T3, T4, ghrelin, leptin, and estradiol) and ELISA [dehydroepiandrosterone (DHEA), amylin (Tot), adiponectin, and growth hormone] (cured: n = 25; failed: n = 10). Average Pearson correlation coefficients and p-values of 50 imputed datasets are presented. Correlation coefficients are expressed as percentages in the colored squares (bottom-left section) and the p-values in the white squares (top-right section). The colorimetric scale represents the correlation coefficient where dark blue squares indicate strong positive correlations (+1) and dark red strong negative correlations (−1).


