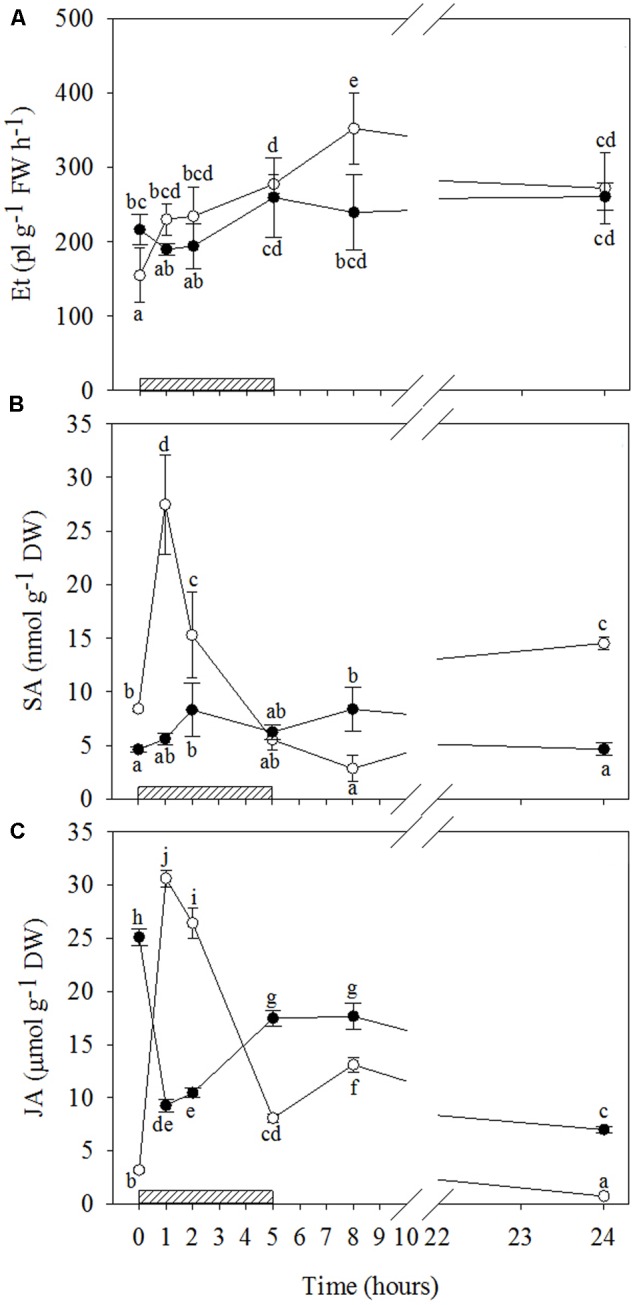
FIGURE 4.

Time course of phytohormones in Quercus ilex plants well-watered (open circle) or water stressed (20% of the effective evapotranspiration daily for 15 days, closed circle) and exposed to acute ozone (200 nL L-1 for 5 h). Data are shown as mean ± standard deviation. The measurements were carried out 0, 1, 2, 5, 8, and 24 h from the beginning of exposure. According to the two-way ANOVA with treatment and time as variability factors, different letters indicate significant differences (P = 0.05). DW, dry weight; ET, ethylene (A); FW, fresh weight; JA, jasmonic acid (C); SA, salycilic acid (B). The thick bottom line indicates the time (5 h) of ozone exposure.
