Figure 4.
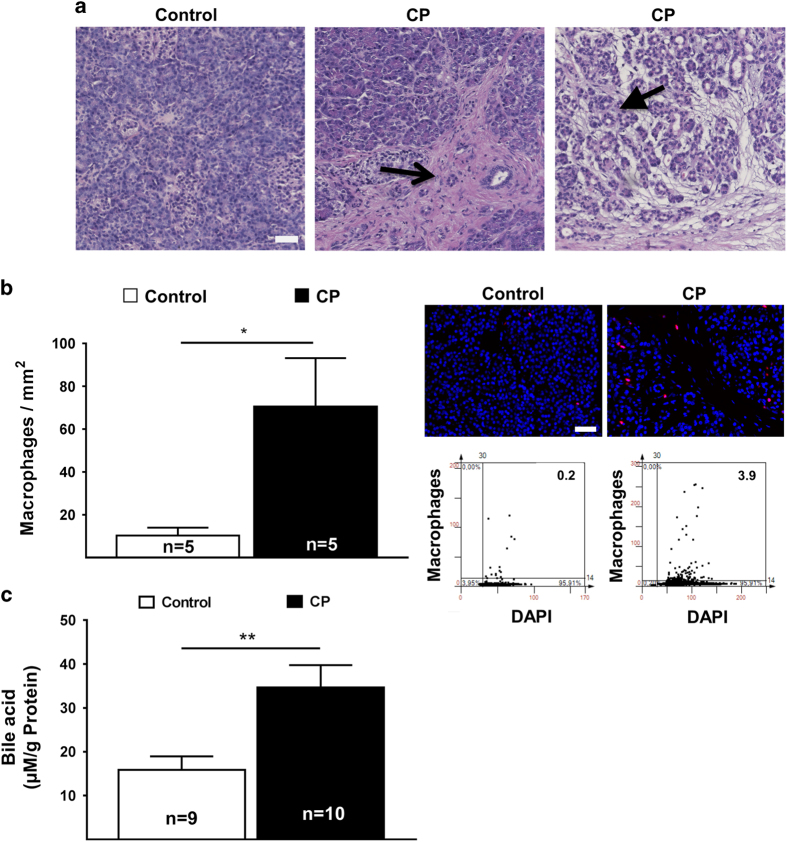
Chronic pancreatitis with elevated local bile acid and with FOXO3 expression. (a) Representative H&E staining of human chronic pancreatic tissue and histopathology score. Open arrow indicate fibrosis, closed arrow indicate destructed tissue with signs of ADMs (20× objective; Scale bar, 20 μm). (b) Increased of macrophage infiltration in human CP tissue, determined by FACS-like IF quantitation and scattergram, stained for DAPI (blue), macrophage marker (red) in control and chronic pancreatitis patients. Macrophage numbers were plotted as means±S.E.M. for the numbers of patients indicated in the graphs. (c) Bile acid concentration was plotted as means±S.E.M. for the numbers of human tissue extract as indicated in the graphs. *P<0.05; **P<0.01; 20× objective; scale bar=20 μm.

