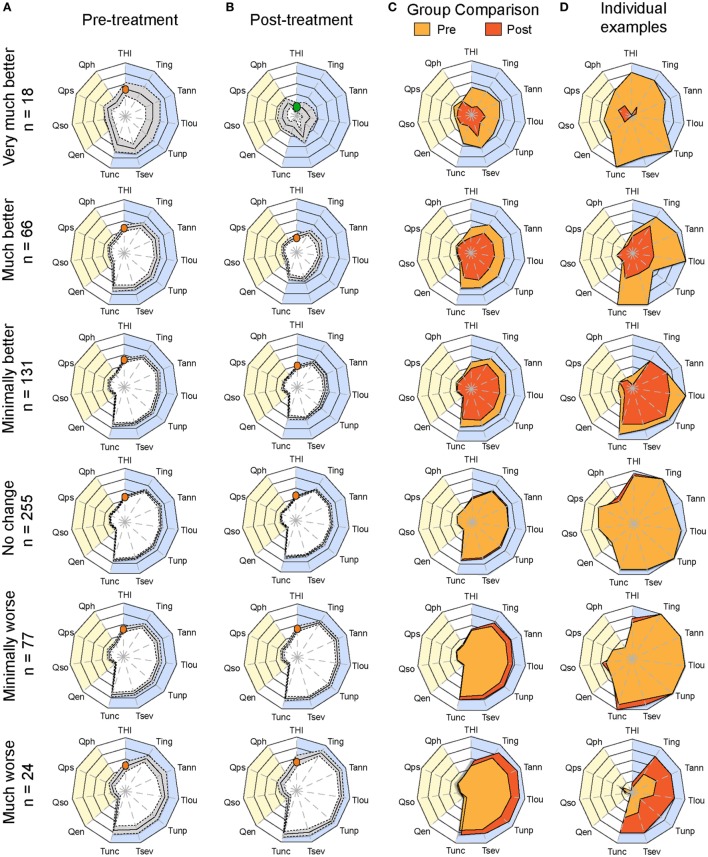
Figure 4.
Plots of average pretreatment and posttreatment scores based on CGI ratings. Radar plots illustrating the evaluation of global changes in tinnitus burden according to measures from (A) baseline (pretreatment) and (B) follow-up (posttreatment) during the evaluation of various treatments within the TRI database. Patients were grouped according to Clinical Global Impression scores and their number is shown on the left. The yellow background represents the quality of life domain evaluated with the WHOQoL-BREF and the blue background gathers the tinnitus domain assessed with the THI and several numerical rating scales. The continuous line in the pretreatment and posttreatment shows the average scores, and the dashed lines illustrate the 95% confidence intervals. (C) Pretreatment (yellow) and posttreatment (orange) average values are presented on the same plot. The orange dot in the THI scale marks the moderate scores of the group for this instrument, whereas the green shows the progression of the group to negligible THI. Note the reduction of tinnitus-associated burden in the “very much better” group. (D) Example of individuals within each CGI category to illustrate changes before and after treatment for the same patient. Instruments are labeled as follows: THI, Tinnitus Handicap Inventory; Tign, Tinnitus Numeric Rating Scale (Ignore); Tann, Tinnitus Numeric Rating Scale (Annoyance); Tlou, Tinnitus Numeric Rating Scale (Loudness); Tunp, Tinnitus Numeric Rating Scale (Unpleasant); Tsev, Tinnitus Numeric Rating Scale (Severity); Tunc, Tinnitus Numeric Rating Scale (Uncomfortable); Qen, WHO Quality of Life (environment); Qso, WHO Quality of Life (social relationships); Qps, WHO Quality of Life (psychological); Qph, WHO Quality of Life (physical health). Statistical analyses comparing (A,B) are available in Table S2 in Supplementary Material.

