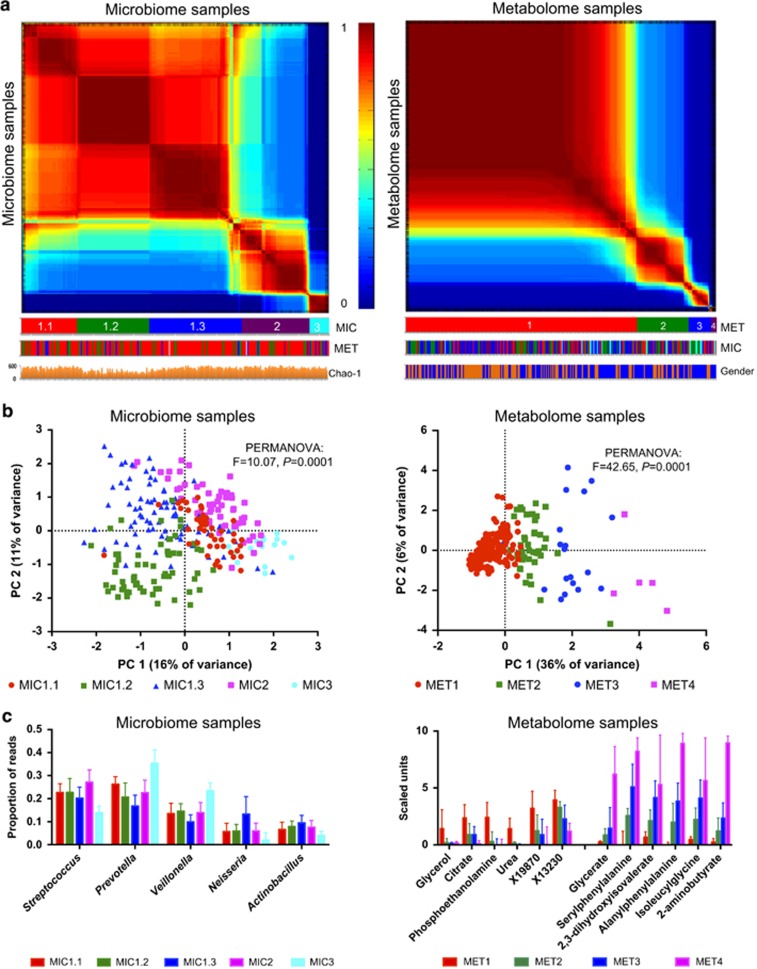
Figure 1.
Heterogeneity of salivary microbiome (left panels) and metabolome (right panels) samples in healthy young adults: (a) spectral clustering co-occurrence plots of the microbiome or metabolome samples ordered along the axes according to the co-occurrence matrix: the more similar the sample profiles, the closer they are together on the axis. Co-occurrence values range from 0 (samples never cluster) to 1 (samples always cluster together) after multiple k-means clustering assignments. The clustering labels are shown below the graphs, according to salivary microbiome (MIC) and metabolome (MET) data sets. Chao-1—estimated species richness per individual microbiome sample. There were significantly more males (gender: blue) than females (gender: orange) in MET_2 and MET_3 clusters and MET_4 contained only males. (b) PCA plots based either on microbiome or metabolome samples. (c) Significantly positively and significantly negatively associated microbial genera and metabolites between samples belonging to different clusters. Only five most abundant genera are shown. Of the 217 negatively associated metabolites only the 6 with the highest negative fold change are shown.

