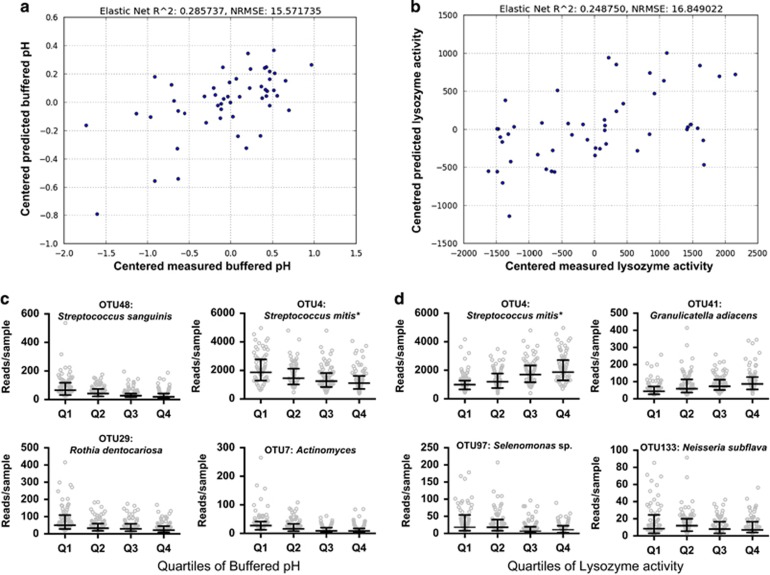
Figure 5.
Results of Elastic Net regression on the salivary microbiome data set in predicting (a) buffered salivary pH and (b) salivary lysozyme activity, where distribution of the top four most stable and abundant OTUs that predicted (c) buffered pH and (d) lysozyme activity are shown. For Elastic Net regression, the mean of the buffered pH or lysozyme activity was subtracted of the measured value as to center the data to a mean of zero. Buffered pH was divided into the following quartiles: Q1: pH 4.1–5.9, Q2: pH 5.9–6.3, Q3: pH 6.3–6.6, Q4: pH 6.6–7.3. Lysozyme activity was divided into Q1: 28–464, Q2: 464–1514, Q3: 1514–2491, Q4: 2491–5635.

