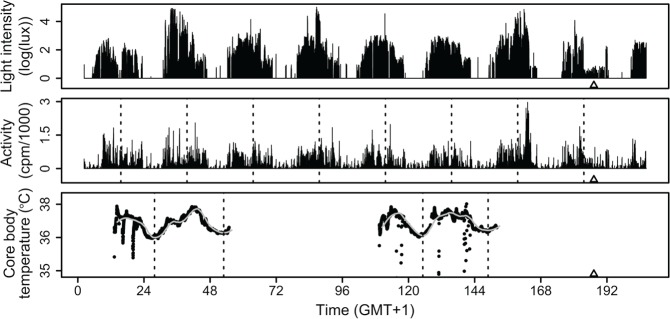
Figure 3.
Compiled dataset of participant BCM15. Top panel: 9 days of ambulatory light intensity data, plotted as log(lux; >1 lux), although the actual modeling was performed on the untransformed lux values. Middle panel: Concomitant ambulatory activity data. Dashed lines mark the estimated time of maximum activity. Bottom panel: Core body temperature data collected by 2 separate CBT pills. The dashed vertical lines mark CBTmin times for days 1, 2, 5, and 6. The gray curve follows the smoothed fit of CBT. △ denotes measured DLMO in all panels.

