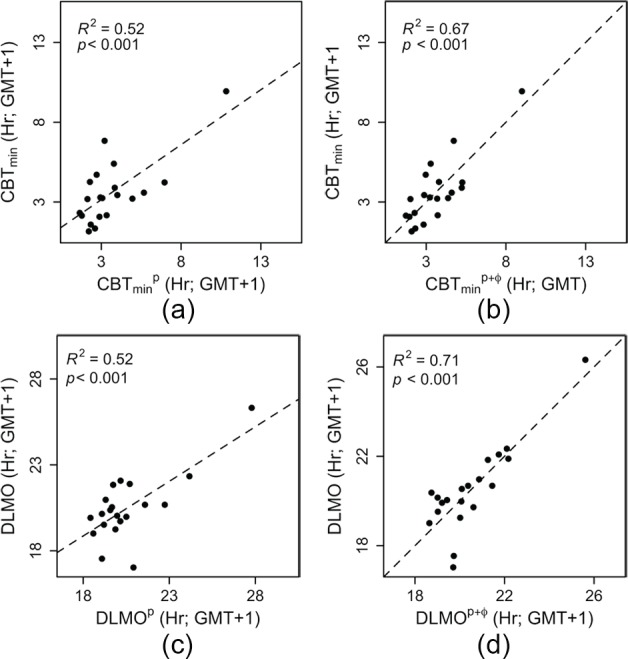
Figure 6.

Model predictions for both CBTmin and DLMO. (A and C) The model-predicted CBTmin and DLMO times (CBTminp and DLMOp) show a significant positive relationship with CBTmin and DLMO, respectively. (B and D) When correcting the model predictions of CBTmin and DLMO for activity acrophase (CBTminp+φ and DLMOp+φ, respectively), 15% more variance in CBTmin and 19% more variance in DLMO were explained. The residual standard deviations corresponding to the regression analyses presented in panels A, B, C, and D were 1.46, 1.24, 1.4 and 1.1 h, respectively.
