Figure 8.
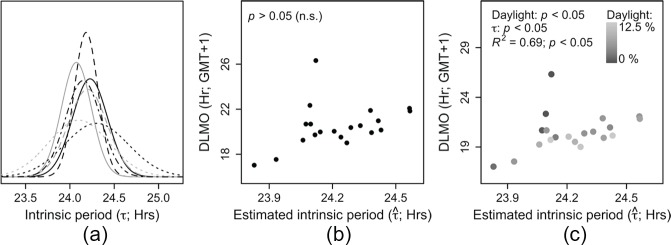
Distribution and relationships of (A) Distribution of estimated intrinsic period compared with a sample of intrinsic period distributions reported using forced desynchrony protocols. The separate intrinsic periods are distributed with means (±SD) of 24.23 (±0.20; {i….n}; field estimation; solid black line), 24.3 (±0.36; Hiddinga et al., 1997; dotted black line), 24.18 (±0.13; Czeisler et al., 1999; dashed black line), 24.07 (±0.17; Wright et al., 2005; solid gray line), 24.10 (±0.34; Gronfier et al., 2007; dotted gray line), 24.2 (±0.13; Burgess and Eastman, 2008; dashed gray line), and 24.15 (±0.20; Duffy et al., 2011; black dotted dashed line). (B) The relationship between DLMO and estimated intrinsic period was not significant. (C) The same relationship as in panel B. The color coding indicates the amount of daylight (% of minutes >615 lux, see Methods) to which each individual was exposed. Later DLMO values were related to longer intrinsic periods, apart from the individuals with the lowest amount of daylight exposure (dark points at ~ 24.1). DLMO was significantly (p < 0.001) explained by both estimated intrinsic period and the amount of daylight exposure, together contributing to a linear model that explained 69% of the variance in DLMO.

