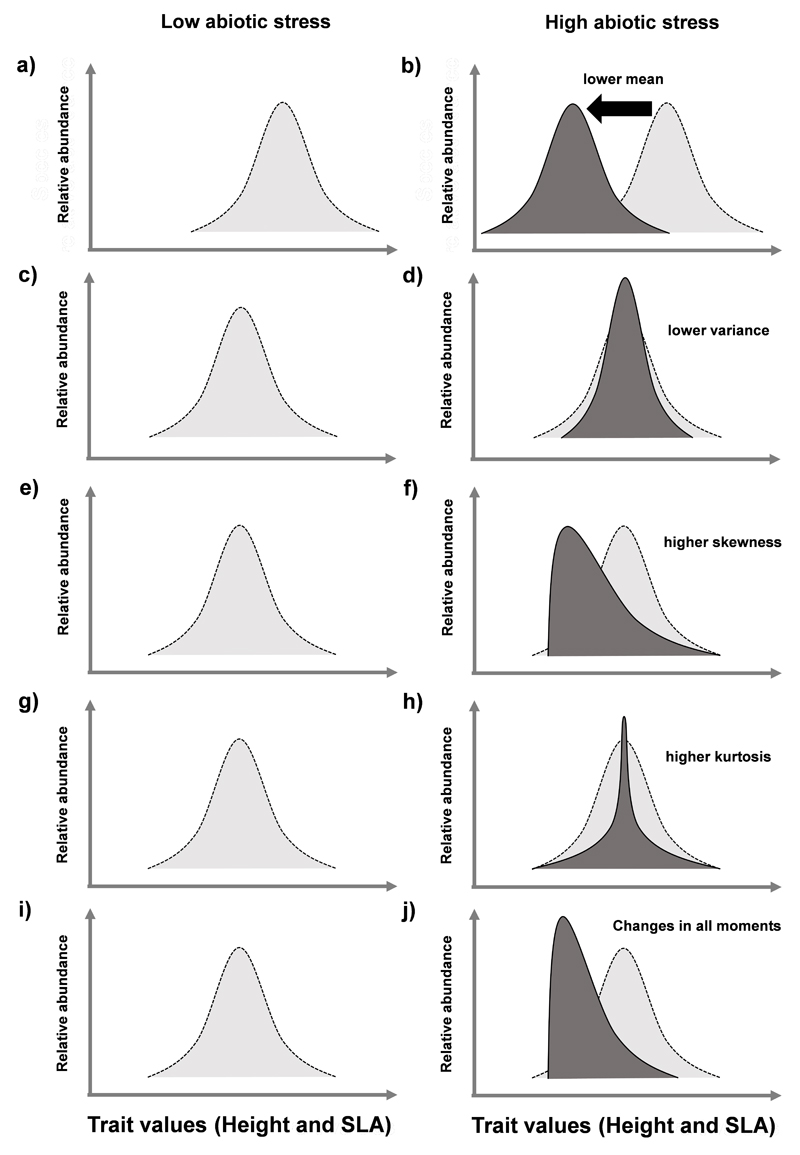
Fig. 1.
Schematic representation of shifts in trait distributions for maximum plant height and specific leaf area (SLA), following the environmental filtering concept. We represent the shifts in mean (a,b), variance (c,d), skewness (d,e), kurtosis (f,g), and all moments together (h,i) of the trait distributions under low and high abiotic stress.

