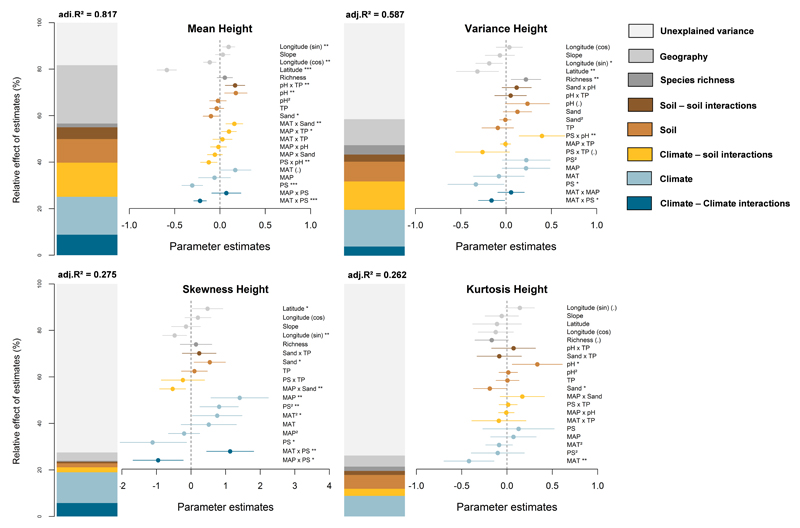
Fig. 2.
Effects of multiple sources of environmental stress and their interactions on the trait distributions for maximum plant height. Results are presented for the mean, variance, skewness and kurtosis of trait distributions. We show the averaged parameter estimates (standardized regression coefficients) of model predictors, the associated 95% confidence intervals and the relative importance of each factor, expressed as the percentage of explained variance. The adj.r2 of the averaged models and the p-value of each predictor are given as: (.), p < 0.1; *, p < 0.05; ** p > 0.01; *** p < 0.001.
MAT: mean annual temperature; MAP: mean annual precipitation; PS: precipitation seasonality; TP: total phosphorus.

