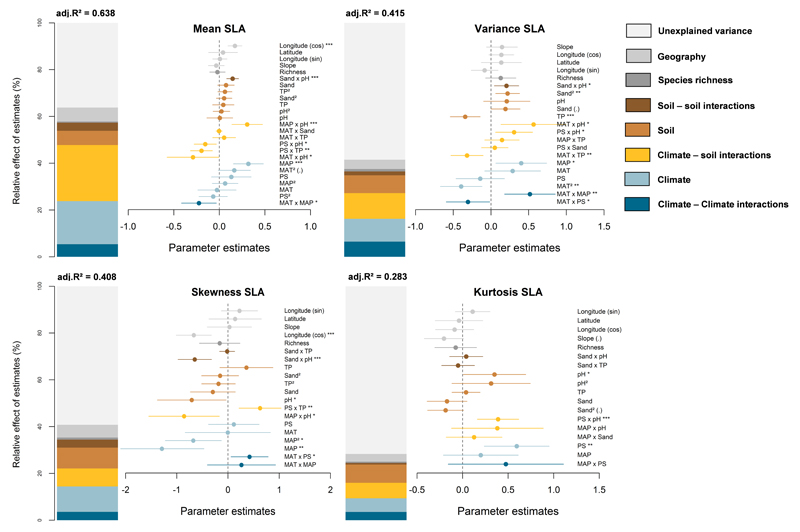
Fig. 3.
Effects of multiple sources of environmental stress and their interactions on the trait distributions for specific leaf area (SLA). Rest of legend as in Fig. 2.
MAT: mean annual temperature; MAP: mean annual precipitation; PS: precipitation seasonality; TP: total phosphorus.

