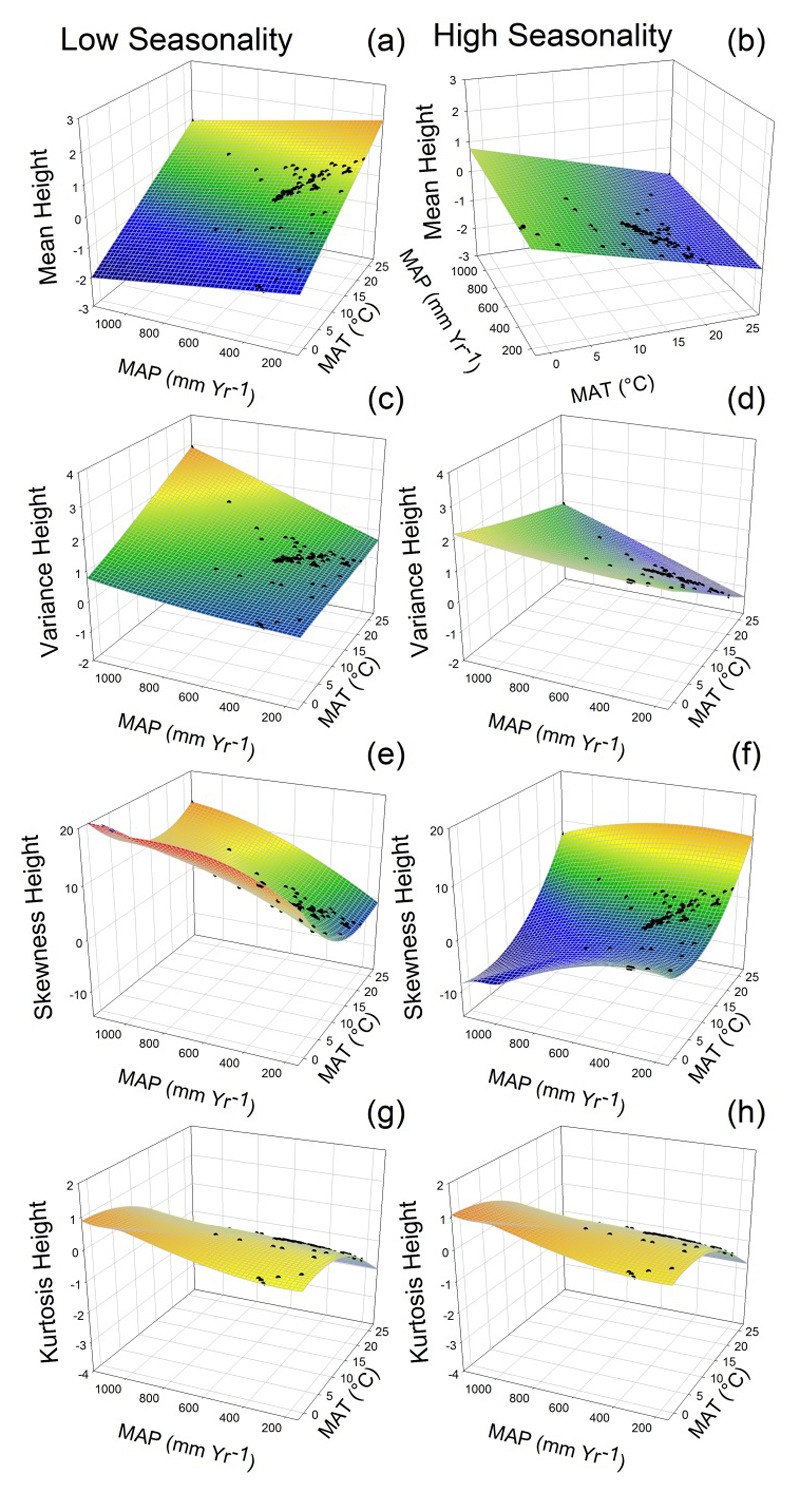
Fig. 4.
Predicted trait distributions (black dots) from the interactions between mean annual temperature (MAT) and precipitation seasonality, and between mean annual precipitation (MAP) and precipitation seasonality for maximum plant height in a 3D plot. We represented the effects of interactions using the standardized parameter estimates of MAT and MAP (Fig. 2). Predictions were calculated for low and high precipitation seasonality (CV seasonality = 12 and CV seasonality = 124, respectively). All other standardized parameter estimates were fixed at their mean value. The colours of the predicted planes change from blue (low values of the moments) to red (high values).

