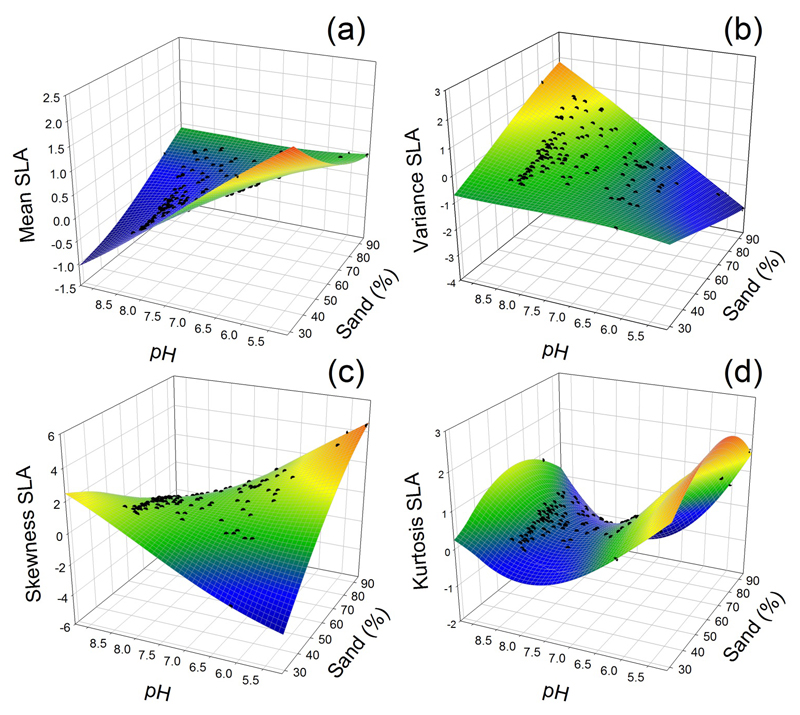
Fig. 6.
Predicted trait distributions (black dots) from the interactions between pH and sand content for specific leaf area (SLA) in a 3D plot. We represented the effects of interactions using the standardized parameter estimates of pH and sand content (Fig. 3). All other standardized parameter estimates were fixed at their mean value. The colours of the predicted planes change from blue (low values of the moments) to red (high values).

