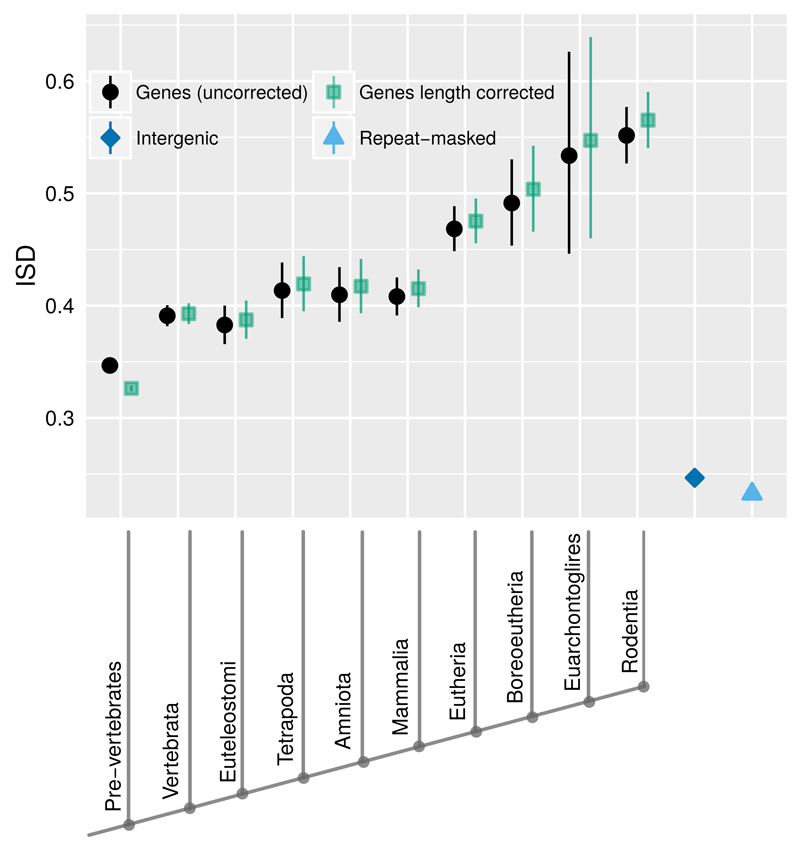
Fig. 2. Young genes have higher ISD (black circles) than old genes.
This result from the analysis of 15,347 mouse genes is unchanged by correction for evolutionary rate, and only becomes stronger after correction for length (green squares). Back-transformed central tendency estimates +/- one standard error come from a linear mixed model, where gene family, phylostratum, and length are random, fixed, and quantitative terms respectively. Importantly, this means that we do not treat genes as independent data points, but instead take into account phylogenetic confounding, and use gene families as independent data points. Length-corrected ISD values are with respect to a standardized length of 179 amino acids. Both young genes and old genes have higher ISD than intergenic sequences (blue diamond) and repeat-masked intergenic sequences (light blue triangle). Phylostrata on the x-axis are labeled according to the clade in which the oldest detectable homolog of a gene can be found. To minimize homology detection bias, the oldest phylostrata have been condensed into a single Pre-vertebrate phylostratum.

