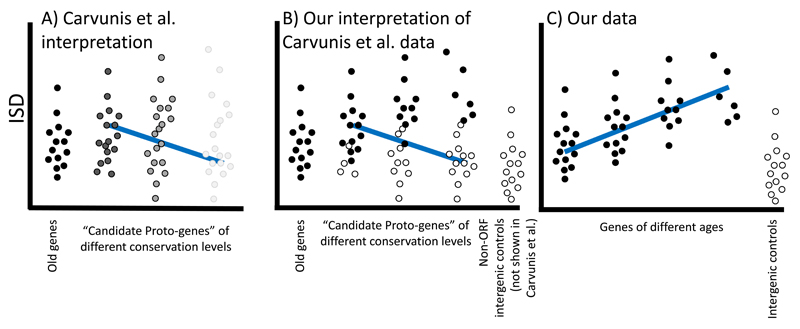
Fig. 5. Putative evidence for the continuum hypothesis can be explained as a statistical artefact known as Simpson’s paradox.
A) The continuum view posits the existence of “proto-genes” that have “characteristics intermediate between non-genic ORFs and genes”3. Candidate proto-genes were classified on the basis of being annotated as ORFs, and having detectable sequence homology in sister species (without necessarily retention of approximate ORF boundaries), and Carvunis et al (2012) claimed to show a continuum of properties as a function of conservation level, shown as a greyscale. B) The same data can be explained without resorting to the existence of such intermediates. Sequence homology for ORFs that are not protein-coding genes (white circles) becomes more difficult to detect as a function of age, such that the proportion of true genes (black circles) increases with age, giving rise to the same observations as A. The downward trend in ISD arises as an example of Simpson’s paradox32. C) By carefully excluding all non-genes, we see the true relationship between gene age and ISD, and compare it to intergenic control sequences that are definitely not protein-coding genes. Note that if true protein-coding genes were excluded in B (rather than excluding non-genes as in C), there would be no relationship with conservation levels.

