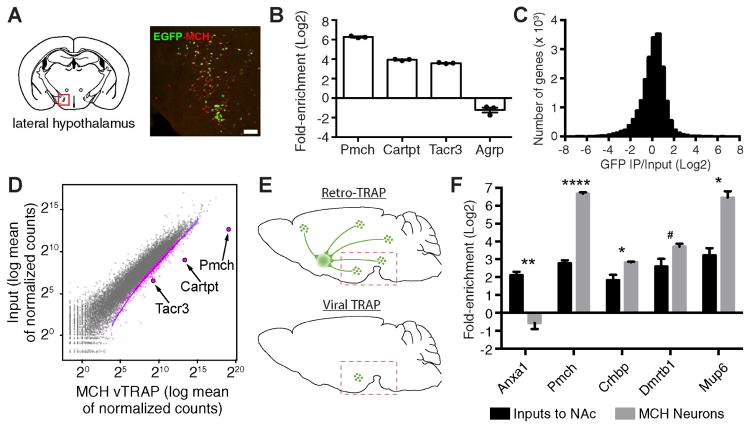
Figure 3. Molecular Profiling of Lateral Hypothalamic MCH Neurons.
(A) Colocalization between EGFP and MCH. Red box indicates region of interest. Scale bar, 200 μm.
(B) qRT-PCR (Mean±SEM) of cell type marker genes (Pmch, Cartpt, Tacr3) and a non-MCH neuron marker gene (Agrp) after IPs from the hypothalamus. p<0.01 for Pmch and Cartpt, and p<0.05 for Tacr3 and Agrp.
(C) Histogram plotting RNA-seq data from MCH neuron vTRAP, displaying number of genes as a function of fold-enrichment.
(D) Scatter plot of RNA-seq results from MCH vTRAP showing normalized counts from IP (x-axis) and hypothalamus input (y-axis). Gray dots represent individual genes (pink are significantly enriched in the IP). MCH neuron markers (Pmch, Carptpt, Tacr3) are highlighted. Blue line is the best fit curve for all enriched genes.
(E) Schemata for Retro-TRAP (top) and vTRAP (bottom). For Retro-TRAP, a retrograde tracing virus, CAV-GFP, is injected into the NAc of SYN-NBL10 transgenic mice, enabling profiling of NAc inputs from midbrain and hypothalamus. For vTRAP, Cre-dependent AAV-FLEX-EGFPL10a is injected into the LH of Pmch-Cre transgenic mice. Dashed box shows approximate dissection site.
(F) RNA-seq comparison (FPKM Mean±SEM) of genes enriched in both Retro-TRAP (Inputs to NAc; data from (Ekstrand et al., 2014)) and MCH vTRAP (MCH Neurons) data sets. *p<0.05, **p<0.01, ****p<0.0001, #p=0.052.
See also Figure S2.

