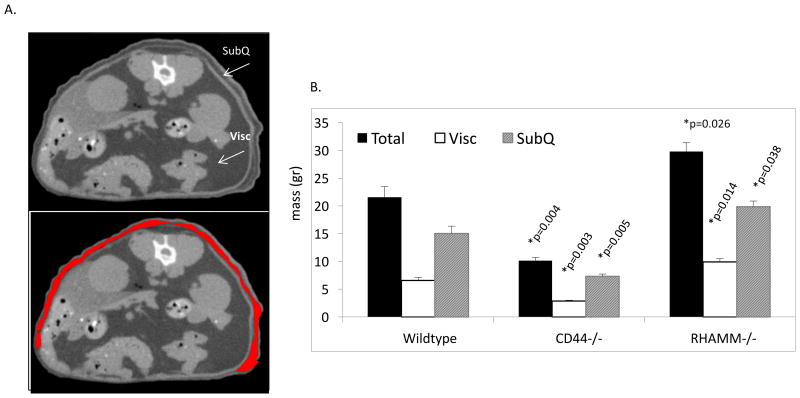
Figure 2. The RHAMM and CD44 mediated change in body mass in female mice results from alterations in adipose tissue.
A. Micro CT image shows a typical optical section through the midsection of a mouse that was used to re-construct a 3-D image of subcutaneous fat (SubQ, extra-abdominal, arrow, lower image, SubQ quantified is outlined in red) and visceral fat (Visc, arrow) from which the values shown in the histogram were derived (as described in Experimental procedures). B. Micro CT analysis of total adipose tissue shows a significant increase in RHAMM-/- vs. wildtype mice and decrease in CD44-/- mice compared to wildtype counterparts. RHAMM-/- mice exhibit significantly increased subcutaneous (p=0.038) adipose tissue compared to wildtype mice while CD44-/- mice exhibit reduced SubQ and Visc. Asterisks indicate the difference between Wildtype and CD44-/- or between Wildtype and RHAMM-/- means are statistically significant and p values indicate the level of statistical significance using a two-tailed Student's T test.

