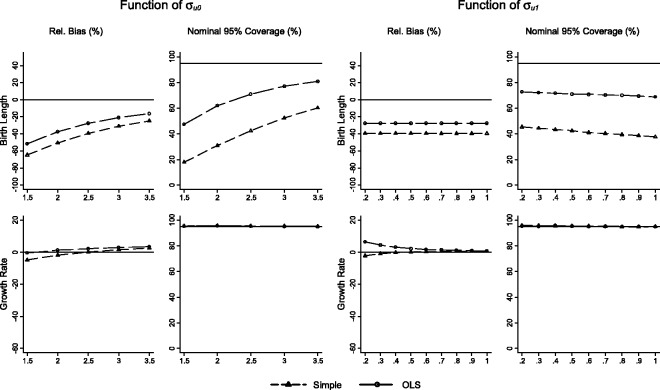
Figure 2.
Performance of the simple and OLS methods displayed as relative bias, and nominal 95% coverage plotted as functions of σu0 (standard deviation of birth length) and σu1 (standard deviation of growth rate) for the effect of birth length on BP, and the effect of growth rate on BP conditional on birth length.

