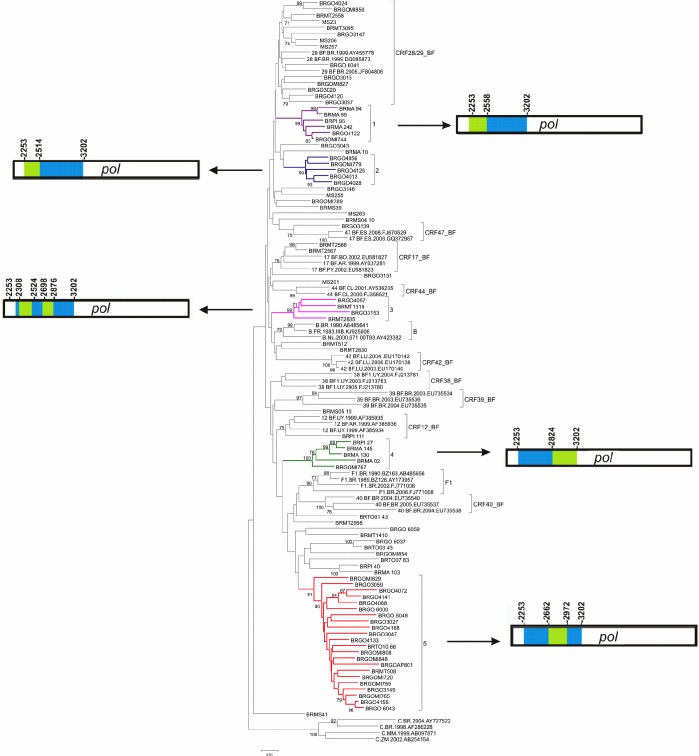
Fig 1. Phylogenetic analysis of 87 pol sequences of B/F1 HIV-1 isolates presenting five highly supported clusters and the mosaic pattern of recombination in each cluster (neighbor-joining method, Kimura 2-parameters evolutive model/1000 replicate bootstrap values).
Bootscanning analyses of BF1 inter-subtype recombinant clusters (# 1–5) are represented. The five clusters identified in our study are indicated by different colors: Cluster # 1: purple, Cluster # 2: blue, Cluster # 3: pink, Cluster # 4: green and Cluster # 5: red. Bootscan analysis was performed in a 200nt sliding window advanced in 20nt step size increments (1.000 replicates). All CRF_BF depicting recombination breakpoints in pol region were included in the analysis. In the mosaic structure representations of BF1 isolates, the breakpoint positions according to HXB2 genome numeration are shown on the right and left sides of the clusters, blue stands for subtype B and green stands for subtype F.

