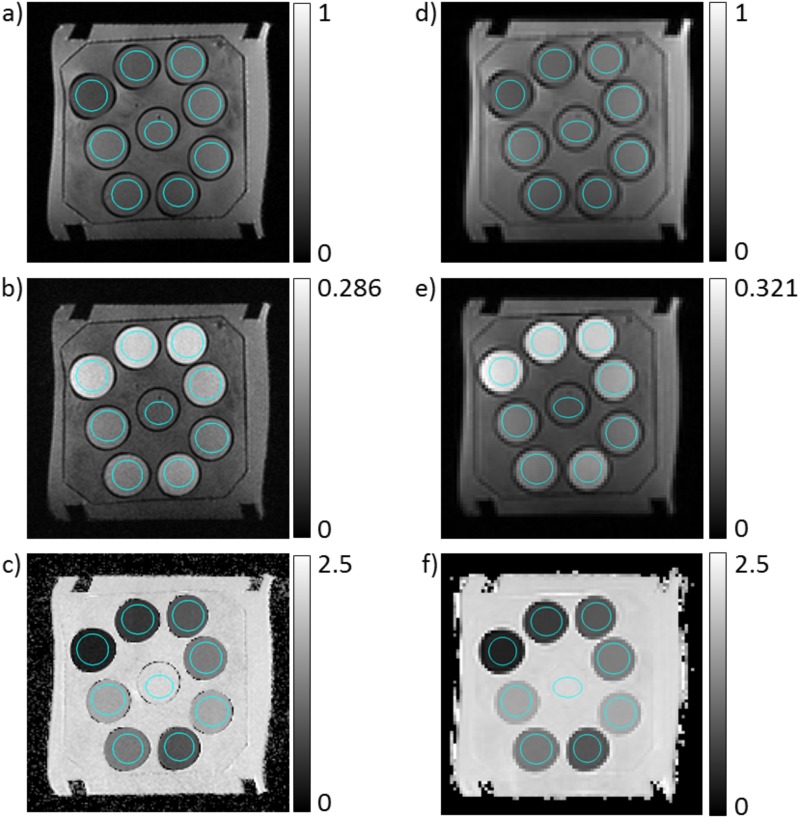
Fig 2. (double column): Images of the used phantom.
a,b,c) High resolution images. d,e,f) Low resolution images. a,d) Signal images without diffusion weighting, i.e. with b = 0 s/mm2. b,e) Signal image with b = 700 s/mm2. Signal images are min-max normalized. c,f) Dapp-maps of the phantom in units of μm2/ms. Cross sections of the volumes of interest are marked in blue in a and d.

