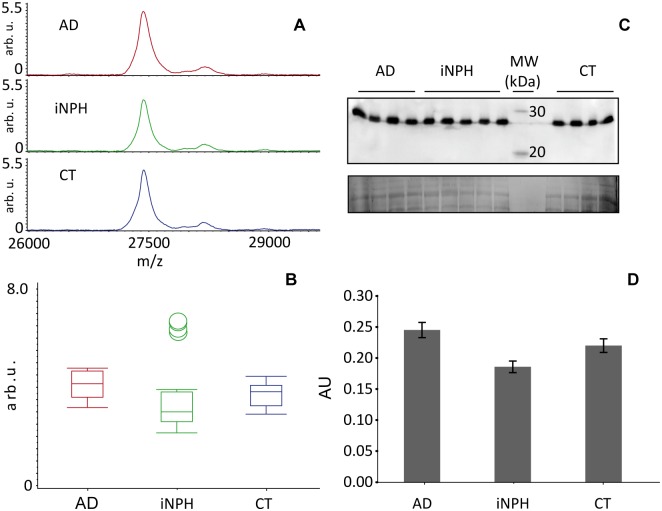
Fig 5. Total Apo A-1 expression analysis.
A) Apo A-1 peak obtained after MALDI profiling of Hu7 immunodepleted serum (m/z range 1500–35000) from AD (average spectrum, red line), iNPH patients (average spectrum, green line), and controls (average spectrum, blue line), showed B) an unchanged expression among classes. C) 50 ug of crude sera from AD and iNPH patients and controls were separated in a 14% T, 4% C polyacrylamide gel, pH 8.8, after separations proteins were transferred to PVDF membranes and incubated with anti-Apo A-1. Normalization was performed from the Sypro Ruby total protein staining. The analysis confirmed the unaltered total Apo A-1 expression as shown by the corresponding box plots (D).

