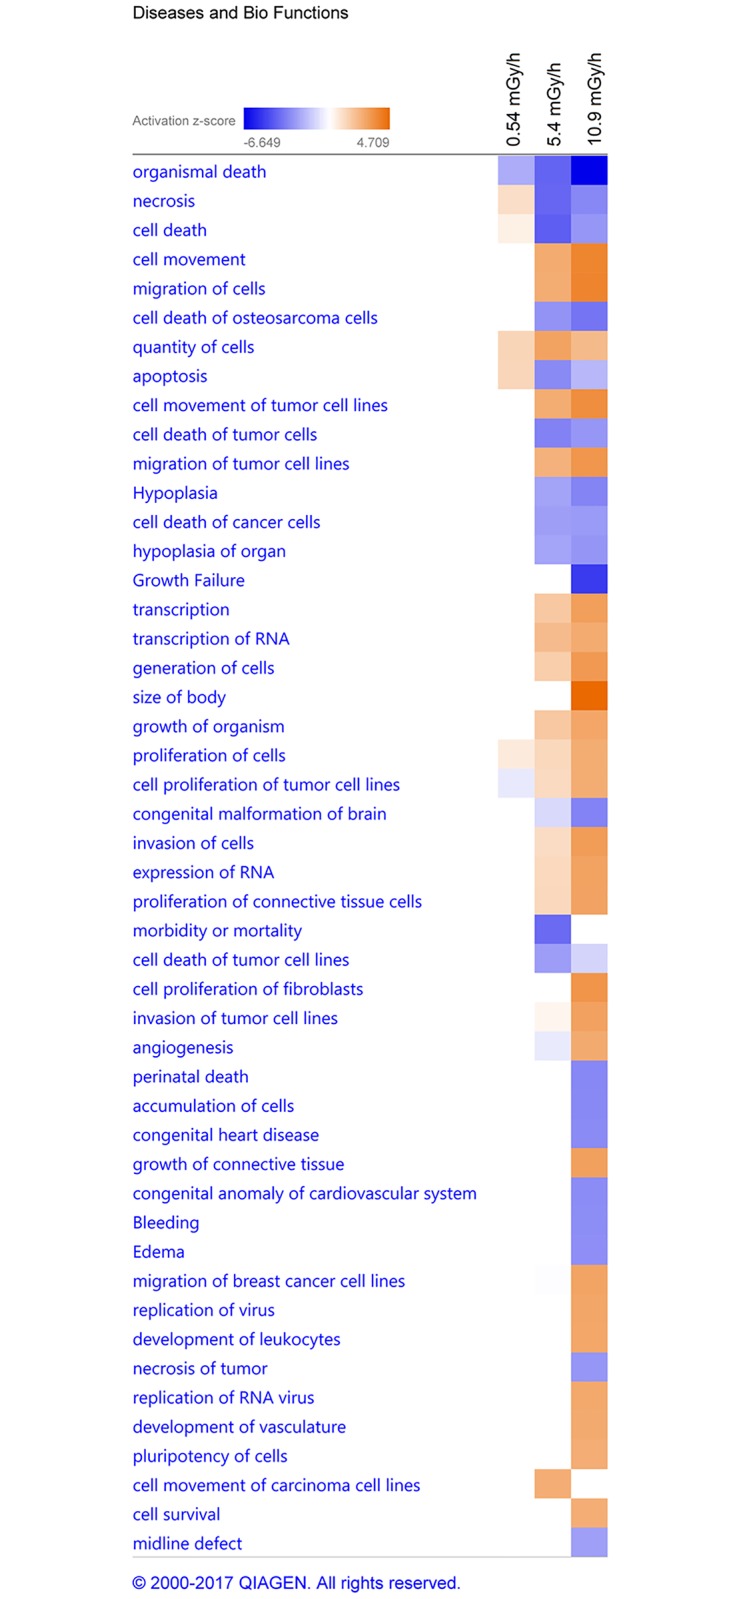
Fig 6. The most affected biological function and diseases networks.

IPA predictions in comparison analysis between 0.54 (1) 5.4 (2) and 10.9 mGy/h (3) group. The heat map is based on the activation z-score, consistent with the particular activation state: “activated” (orange) or “inhibited” (blue). Z-score cut off set to ± 2.5 (arbitrary).
