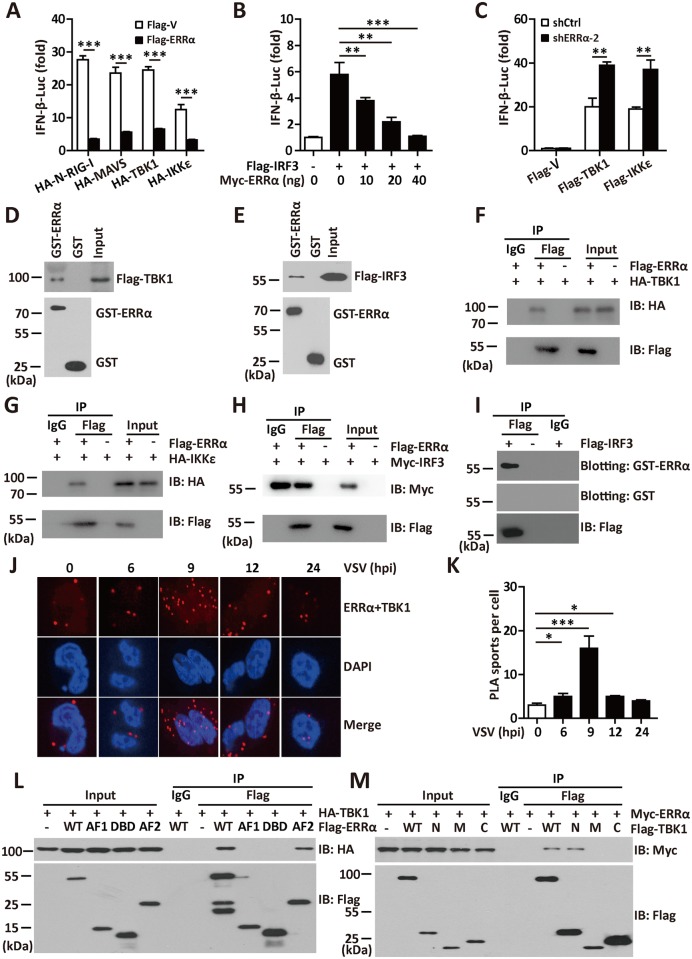
Fig 4. ERRα associates with TBK1, IKKε and IRF3.
(A-B) IFN-β promoter luciferase activity assay in 293T cells transfected with the indicated plasmids. (C) IFN-β promoter luciferase activity assays in shCtrl or shERRα-2 cells transfected with the indicated plasmids. (D-E) GST pulldown assay in 293T cells transfected with Flag-TBK1 (D) or Flag-IRF3 (E). (F-H) Immunoprecipitation analysis in 293T cells transfected with Flag-ERRα and HA-TBK1 (F), HA-IKKε (G) or Myc-IRF3 (H). (I) Far-western analysis in 293T cells transfected with Flag-IRF3. In situ PLA assay of the ERRα-TBK1 complex in 293T cells infected with VSV (MOI = 1.0) for the indicated times. ERRα-TBK1 complex, red; nuclei, blue. Quantification of PLA signals per cell in Fig 4J presented relative to control cells treated with solvent. (L-M) Immunoprecipitation analysis in 293T cells transfected with the indicated plasmids. Cell-based studies were performed independently at least three times with comparable results. The data are presented as the means ± SEM.

