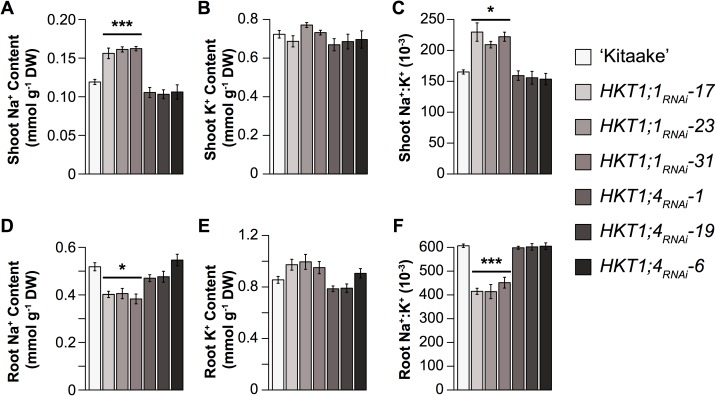
Fig 5.
Root (A-C) and shoot (D-F) ion content of HKT1;1 and HKT1;4 RNAi plants. Asterisks indicate significance as determined using Tukey’s HSD: ***: p < 0.001; *: p < 0.05. Pairwise comparisons were made between lines within each treatment. Error bars represent standard error of the mean where n = 12–20 plants.

