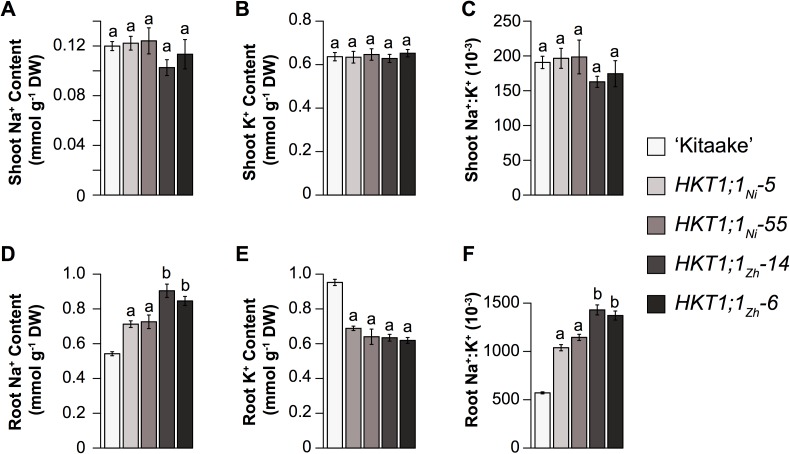
Fig 7.
Shoot (A-C) and root (D-F) ion content for HKT1;1 native overexpression lines. Statistical significance was determined using Tukey’s HSD test between each line within treatments. Bars with the same letters indicate no significant difference (p < 0.05). Error bars represent standard error of the mean where n = 12–18 plants.

