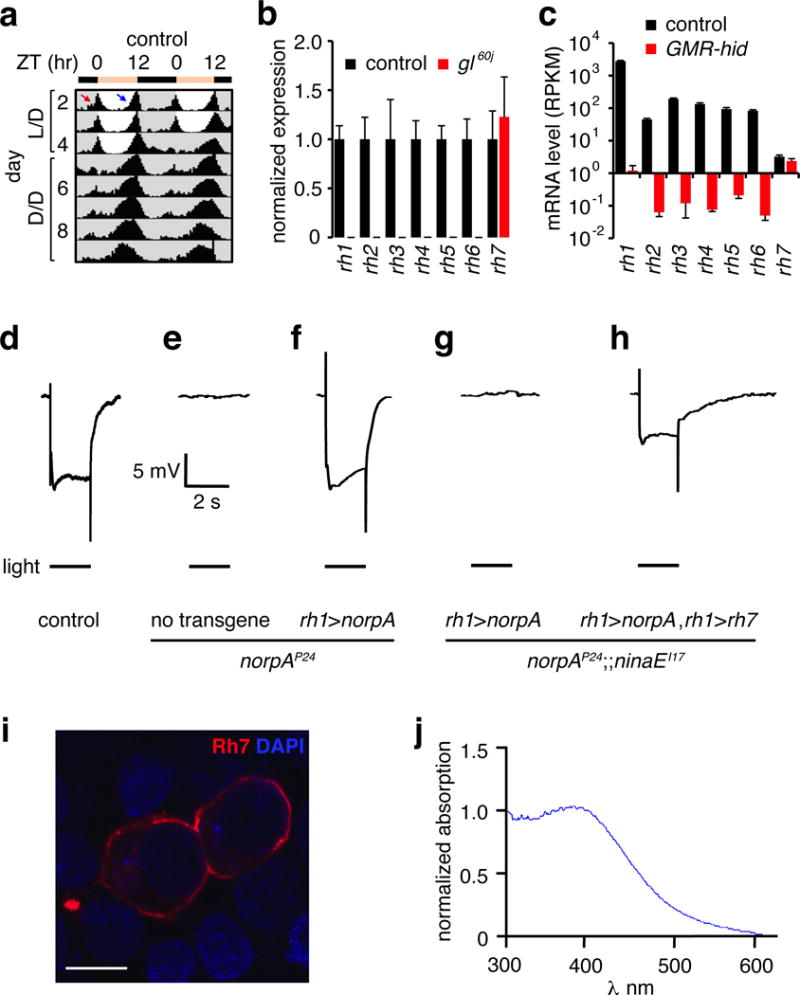
Figure 1. Rh7 is a light receptor.

a, Actogram obtained with control flies entrained under L/D cycles and released to constant darkness (D/D). The red and blue arrows indicate morning and evening anticipation, respectively. n=62. b, Quantitative real-time PCR analysis of opsin genes using RNA from heads. Error bars indicate S.E.M.s. n=3/genotype. c, Opsin RNA-seq mRNA levels were quantified as Reads Per Kilobase of transcript per Million mapped reads (RPKM). Error bars indicate S.E.M.s. d–h, ERG responses using 2 sec light. d, Control. e, norpAP24. f, Expression of norpA using the rh1 promoter (rh1>norpA) in a norpAP24 background. g, Expression of rh1>norpA in a norpAP24;;ninaEI17 background. h, Expression of rh1>norpA and UAS-rh7 under the control of the rh1-Gal4 (rh1>norpA and rh1>rh7, respectively) in a norpAP24;;ninaEI17 background. i, HEK293T cells expressing Rh7 and stained with anti-Rh7. The DAPI stain indicates nuclei. Scale bar indicates 10 μm. j, Absorbance spectrum of Rh7 from HEK293T cells expressing Rh7.
