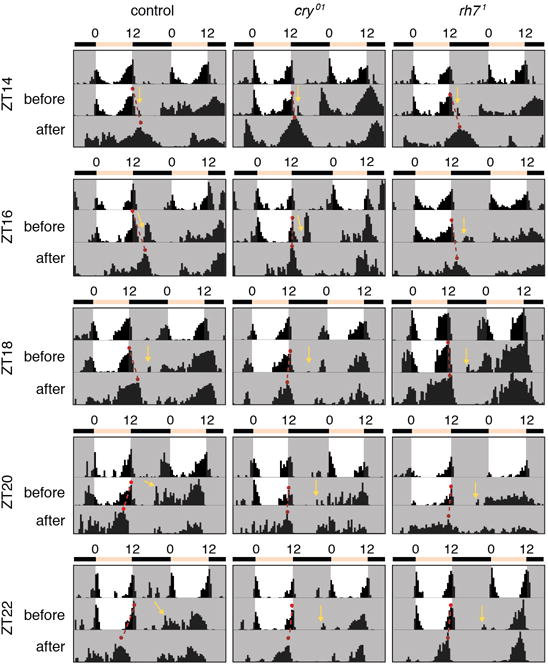
Extended Data Figure 4. Actograms showing representative behaviors of control and mutant flies before and after the 5-minute light pulse at the indicated ZT.

The red dots connected by the dashed red lines indicate the evening peaks before and after the light pulse. Each yellow arrow indicates the times that the animals were exposed to the 5-minute ~600 lux LED light pulse.
