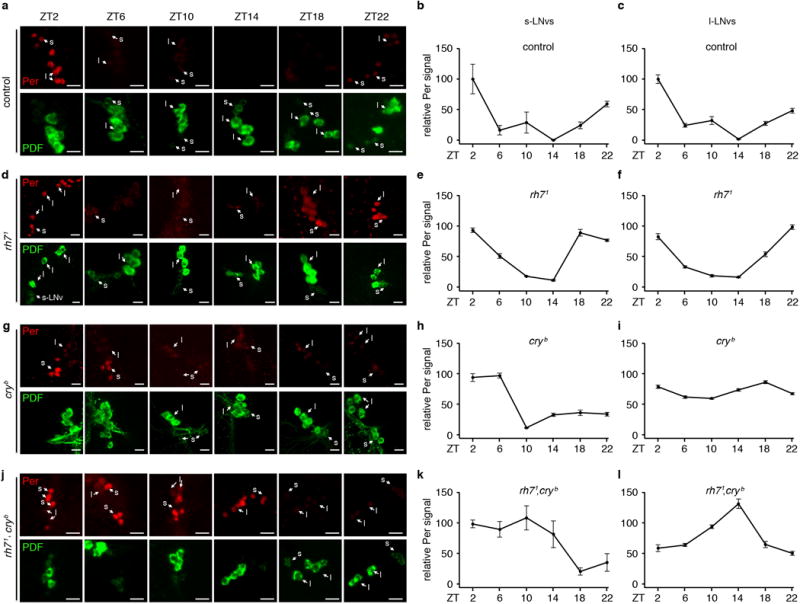
Extended Data Figure 9. Per oscillates in control, rh71, cryb and rh71,cryb flies.

a, d, g, j, Flies of the indicated genotypes were entrained under L/D cycles for 4 days and the brains were dissected on the 5th day. The ZT times indicate when the brains were fixed and dissected for staining with anti-Per (Per, upper rows, red) and anti-PDF (PDF, lower rows, green) as indicated. At least one s-LNV (s) and one l-LNV (l) are labeled in the images obtained at each ZT to facilitate identification of LNVs. The scale bars indicate 10 μm. b, c, e, f, h, i, k, l, Quantification of relative Per levels in s-LNvs and L-LNVs of flies of the indicated genotypes. The image quantification was performed using ImageJ. The Y-axes indicate relative Per intensities. The Per intensities in ZT2 of the control flies were designated as 100. For control flies, ZT10, n=6; ZT22, n=8, and n=5 for all other time points. For rh71, ZT2, n=9; ZT6, n=8; ZT10, n=6; ZT14, n=8; ZT18, n=8; ZT22, n=7. For cryb, ZT2, n=8; ZT6, n=9; ZT10, n=8; ZT14, n=7; ZT18, n=10; ZT22, n=8. For rh71,cryb, n=5 for all time points. Error bars indicate S.E.M.s.
