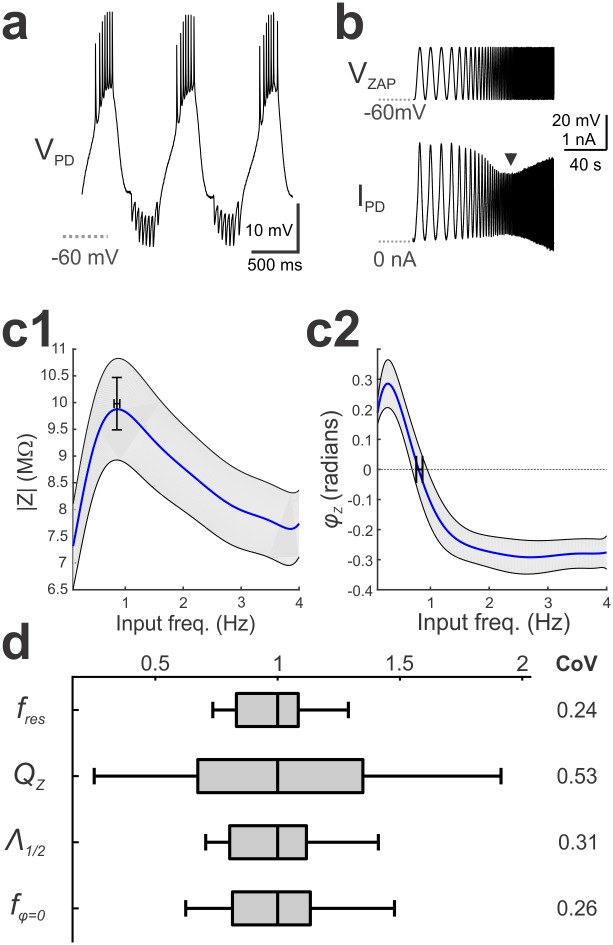
Fig 1. Membrane potential resonance MPR of the PD neuron was measured in voltage clamp.
a. During ongoing activity, the PD neuron shows a slow-wave voltage waveform ranging approximately between -60 and -30 mV. b. The membrane potential (Vzap) and the injected current (IPD) were recorded when the PD neuron was voltage-clamped using a ZAP function between -60 and -30mV and sweeping frequencies between 0.1 and 4 Hz. The arrowhead indicates resonance, where the current amplitude is minimal and Z is maximal. c. The impedance amplitude Z(f) (c1) and phase φ(f) (c2) profiles of the PD neuron recorded in 18 preparations. The cross bars show the mean and SEM of fres and Zmax (c1) and fφ = 0 (c2). The shaded region indicates the 95% confidence interval. d. The range of three Z(f) attributes fres, QZ, and Λ1/2 and one φ(f) attribute fφ = 0. Each attribute was normalized to the median of its distribution for cross comparison. CoV is the coefficient of variation.

