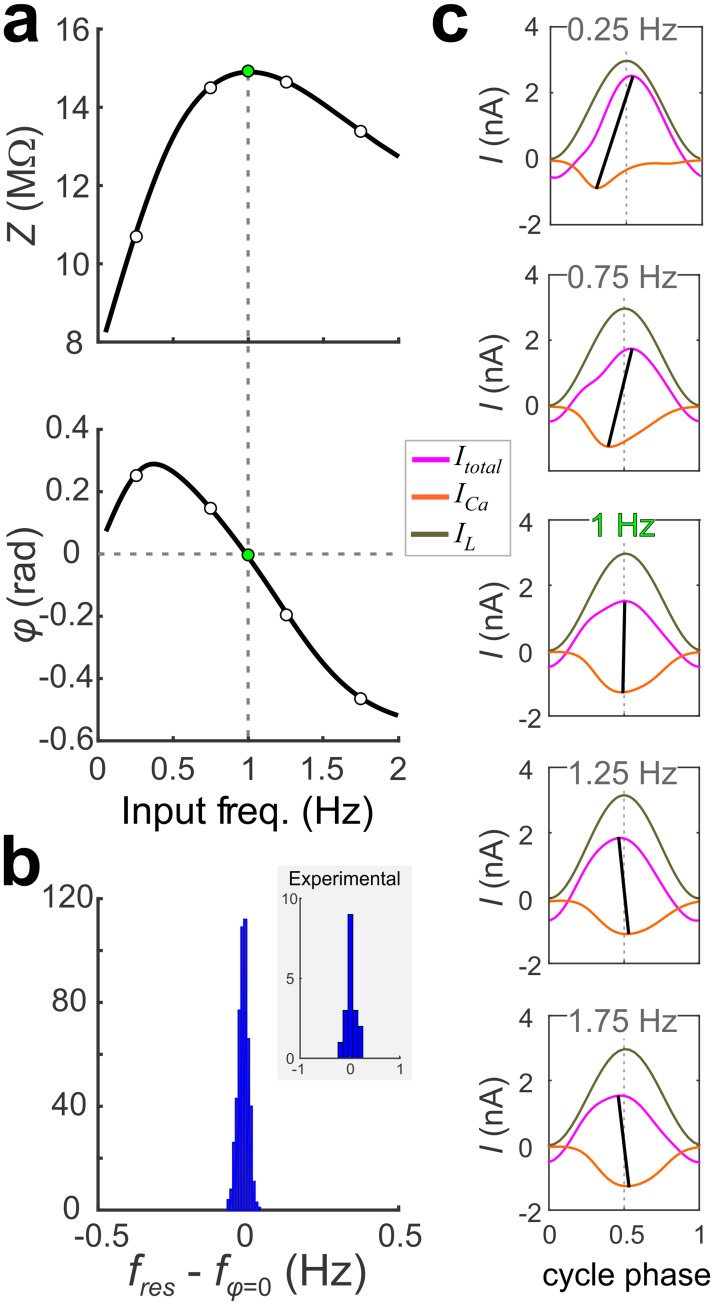
Fig 4. fres and fφ = 0 of the optimal models are nearly identical.
a. Z(f) (top) and φ(f) (bottom) for a representative optimal model. Green dots indicate fres (top) and fφ = 0 (bottom). b. Histogram showing the difference between fres and fφ = 0 for 500 randomly selected models. A comparison of fres and fφ = 0 of the experimental data of the PD neuron shows a similar distribution (inset, N = 18). (c) Plots of steady-state responses of ICa, IL, and Itotal to sinusoidal voltage inputs at the frequencies marked in panel a shown as a function of normalized time (cycle phase). Dotted vertical line indicates cycle phase 0.5 where the passive currents peak. Solid lines connect the minimum of ICa to the peak of Itotal. The two lines nearly align at fφ = 0.

