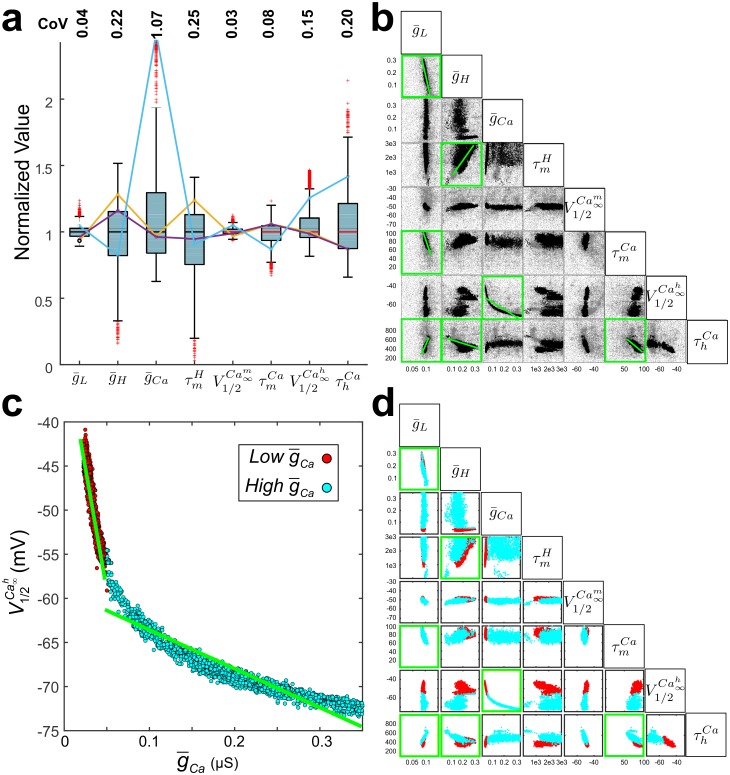
Fig 6. The optimal models show variability in individual and pairs of parameters.
a. The range of parameters for all optimal models (~9000). Each parameter is normalized by its median value for cross comparison. The median values were , , , , , , , . Three representative optimal model parameter sets are shown (cyan, orange, purple solid line segments) indicating that widely different parameter combinations can produce the biological Z(f) and φ(f). CoV is coefficient of variation. b. Pairwise relationships among parameters of all optimal models (black dots). The range of parameter space was sampled within the prescribed limits given to the optimization routine, shown by including the sampled non-optimal models (grey). Permutation test showed significant pairwise correlations (green highlighted boxes with linear fits shown as green lines). c. Optimal models could be separated into two highly significant linear fits (green lines) in according to whether < 0.05 (red; Low ) or > 0.05 (cyan; High ). d. All pairwise relationships, separated on the low or high (colors as in panel c). Green boxes are the same as in b.

