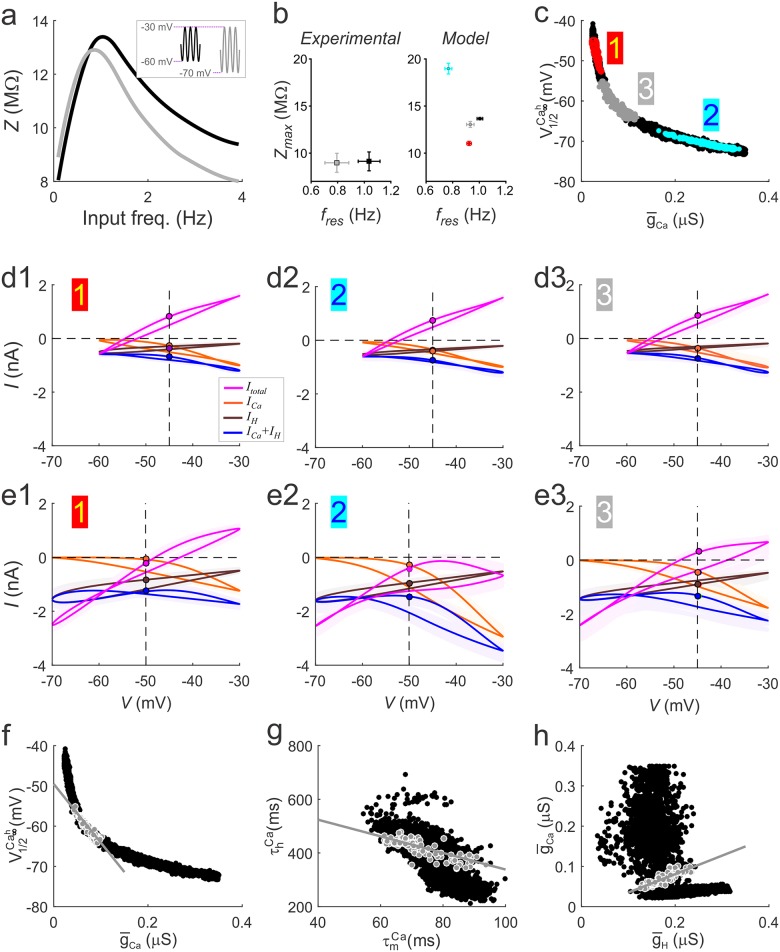
Fig 7. The effect of the lower voltage bound Vlow of oscillations on fres and Zmax constrains the optimal models.
a. An example of the change in Z(f) measured in the biological PD neuron for Vlow = -60mV (black line) and Vlow = -70mV (grey line). Inset shows the bounds of voltage clamp inputs in the two cases. b. Shifting Vlow from -60 mV to -70 mV lowers the value of fres measured in the PD neuron significantly, without influencing Zmax (b. Experimental). fres and Zmax values measured in a random subset of optimal model neurons corresponding to low or high values produced the same fres and Zmax values at Vlow = -60mV (black dots), but distinct fres and Zmax values at Vlow = -70mV (low : red dots; high : cyan dots). A subset of optimal models could reproduce the experimental result in which fres shifted to significantly lower values without affecting Zmax. (grey dots). (c) relationship separating out the different groups of models producing different responses to changes in Vlow (colors correspond to b Model panel). Models depicted by grey dots are referred to as intermediate models. (d1-e3) mean voltage-gated ionic currents ICa, IH and ICa+IH and Itotal, shown as a function of voltage for Vlow = -60 mV (d1-d3) and Vlow = -70 mV (e1-e3). Numbers correspond to the location along the as shown in c. f. The intermediate models (grey dots) show a distinct linear correlation. g. Intermediate models (grey dots) show a distinct and tighter correlation compared to all optimal models (black dots). h. Intermediate models (grey dots) show a strong linear correlation that is not observed for all optimal models (black dots).

