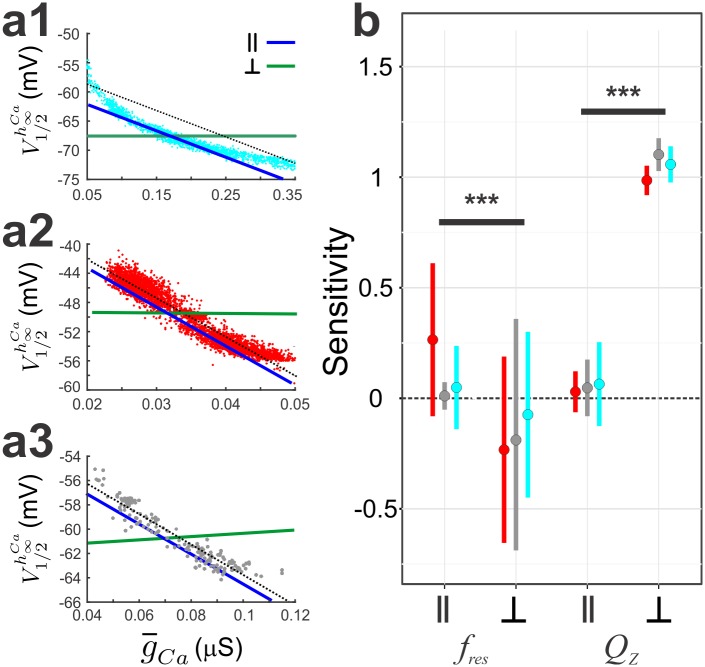
Fig 9. Assessing the dependence of fres and QZ on the linear correlation.
a. Parameter values for each model were changed along a line parallel (‖, blue) to the correlation line (black) or along a perpendicular line (┴, grey). This was done for models with high (cyan; a1), low (red; a2) and intermediate (grey; a3) models. For each model and each line, ‖ or ┴, we fit a line to the relative change in either fres or QZ as a function of the relative change in . b. The sensitivity values of fres or QZ to ‖ or ┴ are shown for the three groups.

