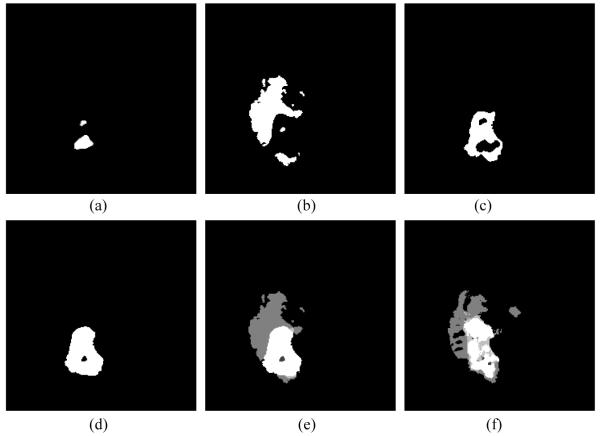
Figure 5.
An example of tumor growth model by using proposed method for one slice of patient 439. (a) Simulated necrosis with D = 0.052, ρ = 0.01. (b) Edema with D = 0.06, ρ = 0.009. (c) Non-enhancing tumor with D = 0.03, ρ = 0.014. (d) Enhancing tumor with D = 0.05, ρ = 0.01. (e) Fused label and (f) ground truth of the second scan data.

