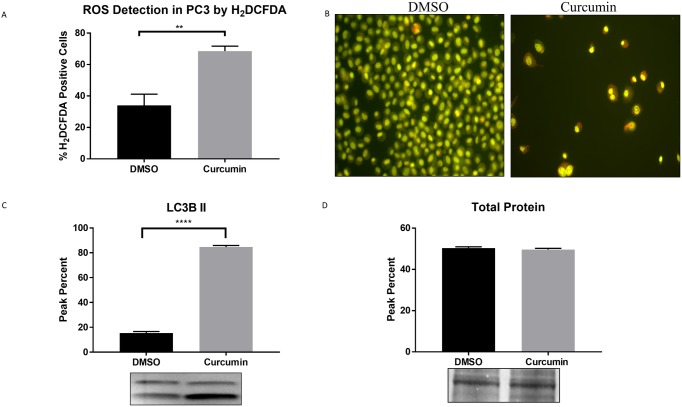
Fig 4. Curcumin promotes oxidative stress and autophagy.
(A) Increased production of ROS was measured using the H2DCFDA technique by flow cytometry. (B) Acridine orange fluorescence micrographs in curcumin and DMSO treated PC3 cells. (C) LC3B II protein expression analyzed by western blot. D. Total protein expression by india ink staining. Statistical significance between Curcumin and DMSO was determined by unpaired t-test, ** p≤0.01, **** p≤0.0001.

