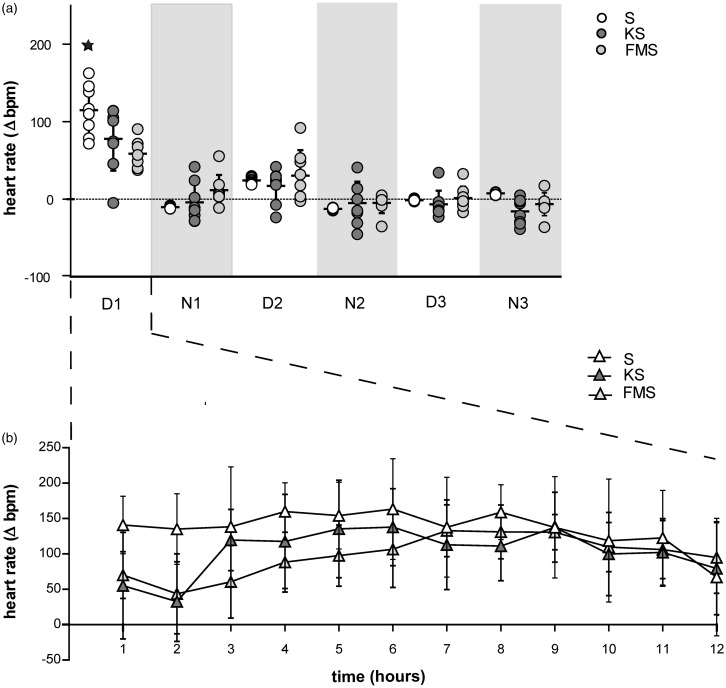
Figure 3.
Heart rate during immediate post-operative recovery phase (12 h) and for three light–dark cycles following anesthesia and surgery. (a) Mean ± SD (n = 7) of heart rate deviation in beats per minute (Δbpm) for three light–dark cycles following the experimental procedure. Circles show the mean results of individual animals. Asterisks indicate significance (P ≤ 0.05) compared to baseline and between groups. Dark phase is indicated by the light grey background. (b) Mean ± SD (n = 7) heart rate deviation during immediate post-operative recovery phase (12 h [light phase] following experimental procedure) in beats per minute (Δbpm) compared to baseline values obtained before the experimental procedure at the corresponding time of day in conscious mice

