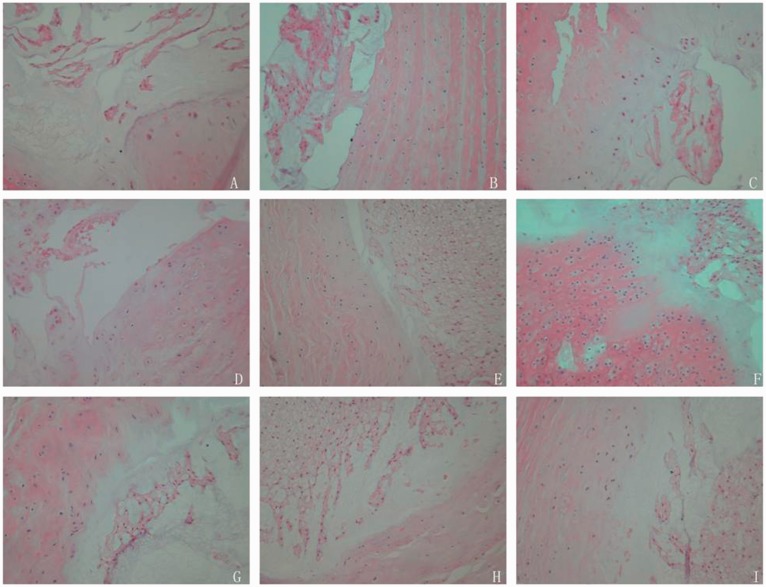
Figure 1.
HE staining of experimental, control and normal groups at different periods. There was significant disc degeneration in control group (P < 0.05). There was no significant different in disc degeneration between control group and experimental group (P > 0.05). (a–c) corresponded to the second, fourth, and sixth weeks in normal group. (d–f) corresponded to the second, fourth, and sixth weeks in control group. (g–i) corresponded to the second, fourth, and sixth weeks in experimental group. (A color version of this figure is available in the online journal.)

