
Figure 12.
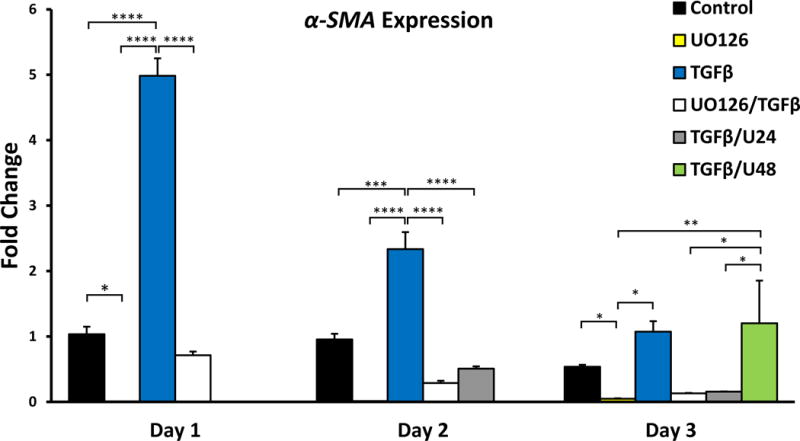
Mean fold changes in expression of α-SMA over 3 days, normalized against GAPDH expression (A; error bars represent S.E.M). UO126 reduced α-SMA expression. ANOVA followed by Tukey’s post-hoc test was used to infer statistical significance (B; *p<0.05; **p<0.01; ***p<0.001; ****p<0.0001).