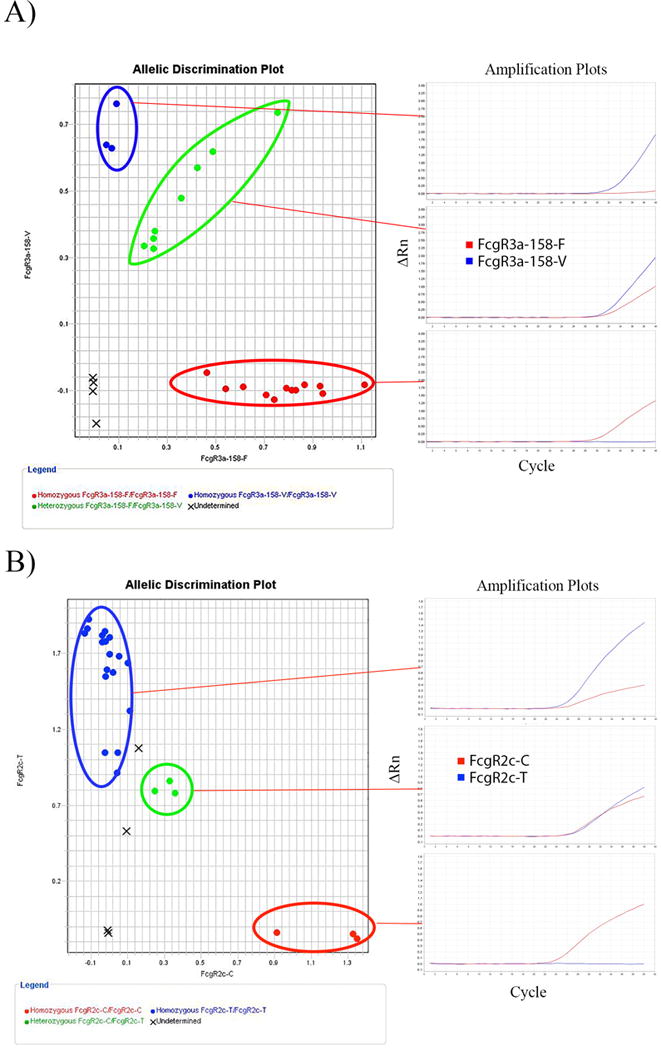
Figure 2. Example of Allelic Discrimination Plot results for FCGR3A and FCGR2C.

(A) Each allelic variant is separated into quadrants of the plot. Amplification of the ATTO532-T probe, but not of the FAM-G probe, indicates a V/V genotype (blue). Amplification of the FAM-G probe, but not of the ATTO532-T probe, indicates a F/F genotype (red). Amplification of both FAM-G probe and ATTO532-T probe, indicates a V/F genotype (green). No template controls are noted by an “X”. Additionally, samples for which the genotype could not be determined based on the algorithm within the software are also labeled as “X” in the center of the plot. (B) Each allelic variant is separated into quadrants of the plot. Amplification of the FAM-T probe, but not of the ATTO532-C probe, indicates a T/T genotype (blue). Amplification of the ATTO532-C probe, but not of the FAM-T probe, indicates a C/C genotype (red). Amplification of both FAM-T probe and ATTO532-C probe, indicates a C/T genotype (green).
