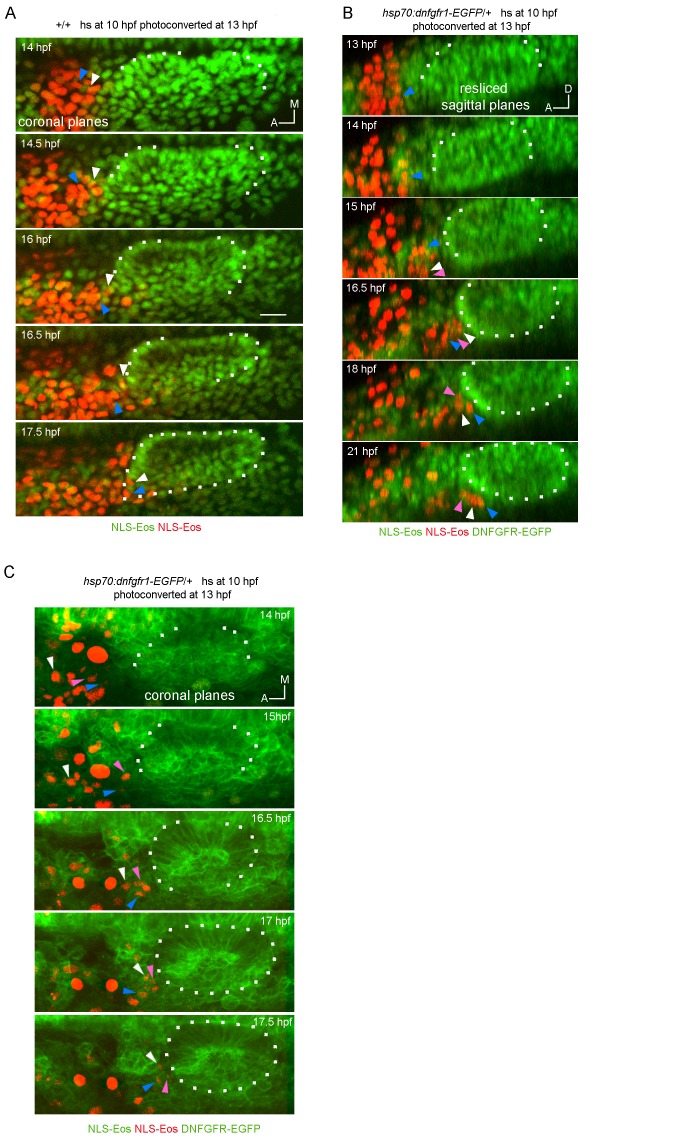
Author response image 5. Tracking of photoconverted NLS-Eos nuclei in wild type (A) and hsp70:dnfgfr1-EGFP/+ embryos (B and C).
z-projections of coronal (A and C) or resliced sagittal (B) views are shown. These images were selected from 3D time lapses performed at 5 min time resolution, which allowed us to track individual cells over time. Arrowheads indicate examples of tracked nuclei (each color correspond to a different cell). In the two first time points of (B), it was not possible to track the cells indicated with white and pink arrowheads in the following time points, because they move laterally out and in of the video during their posterior migration.

