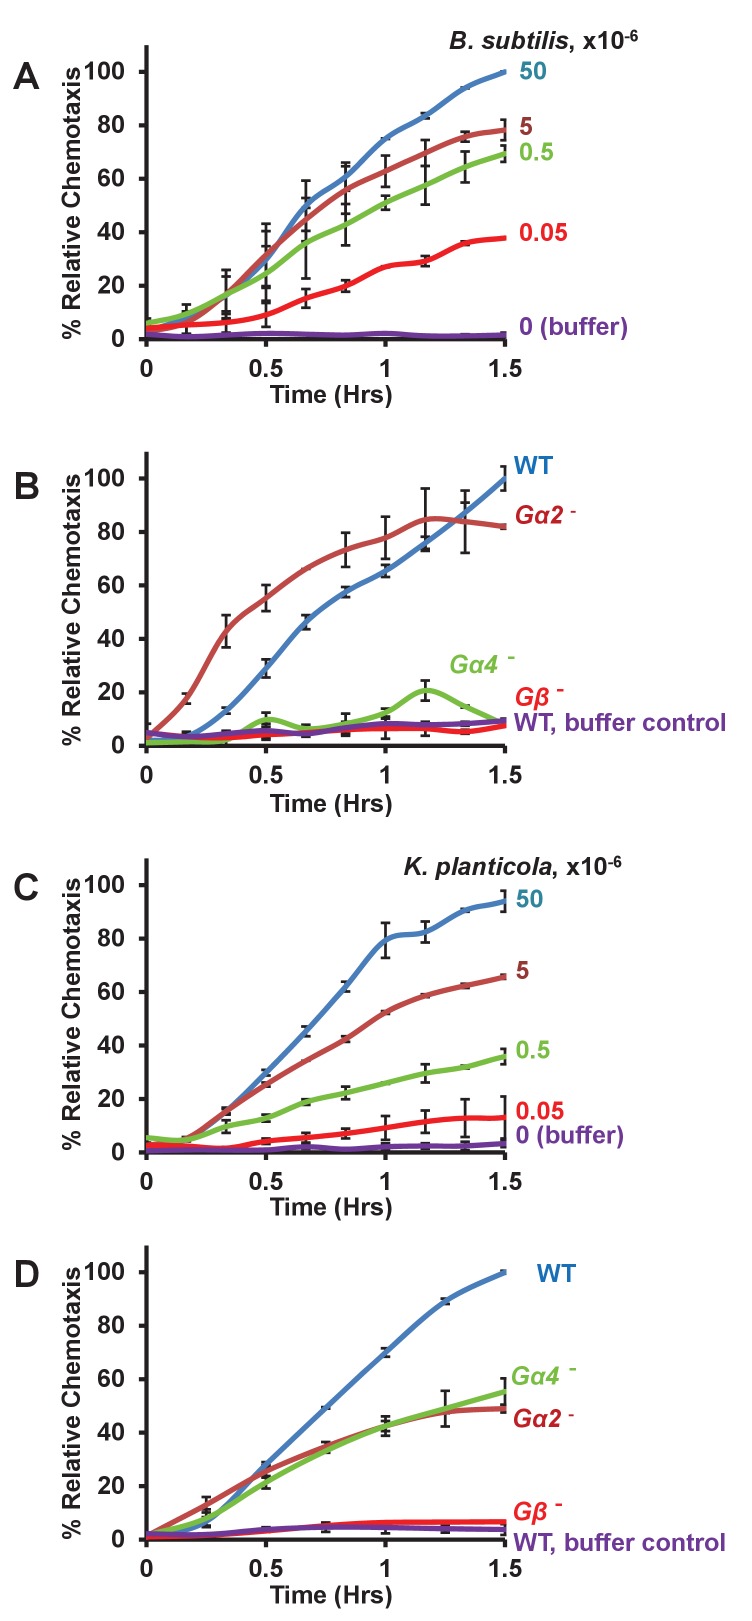
Figure 2. Chemotaxis to live bacteria.
(A) Time-course quantification of WT Dictyostelium migration to various numbers of Bacillus subtilis. Relative chemotaxis is normalized to 5 × 10⁷ bacteria at 1.5 hr. Standard deviations are shown based upon three replicates. (B) Time-course quantification of WT and Gα2-, Gα4-, and Gβ-null Dictyostelium migration to 5 × 10⁷ Bacillus subtilis or to buffer controls. Relative chemotaxis is normalized to WT Dictyostelium at 1.5 hr. Standard deviations are shown based upon three replicates. (C) Time-course quantification of WT Dictyostelium migration to various numbers of Klebsiella planticola. Relative chemotaxis is normalized to 5 × 10⁷ bacteria at 1.5 hr. Standard deviations are shown based upon three replicates. (D) Time-course quantification of WT and Gα2-, Gα4-, and Gβ-null Dictyostelium migration to 5 × 10⁷ Klebsiella planticola or to buffer controls. Relative chemotaxis is normalized to WT Dictyostelium at 1.5 hr Standard deviations are shown based upon three replicates.

