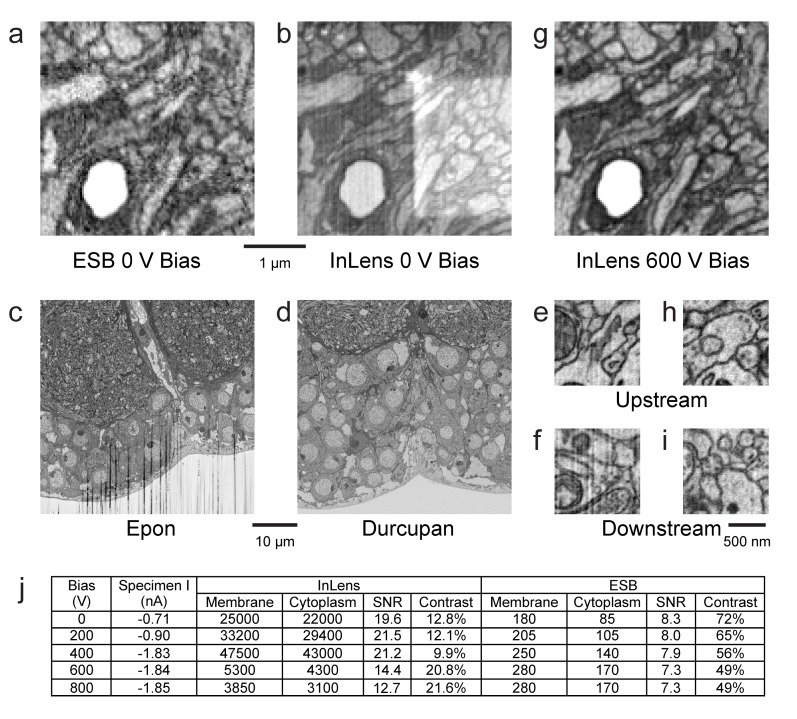
Figure 11. Images of ultra-thin section of Drosophila brain on silicon substrate highlight the advantages of our specimen bias scheme.
(a) EsB signals had higher contrast but lower signal-to-noise ratio (SNR) compared to InLens (b). With 600 V bias (g), InLens contrast substantially increased, with only a small drop in SNR. In addition, artifacts such as electron burn marks were eliminated by the positive bias. Streak artifacts depend on embedding resin; Epon (c) is far less satisfactory than Durcupan (d). Streak artifacts are less prominent upstream (e,h) and more prominent downstream of the ion milling (f). A 600 V bias can eliminate the surface topography contrast that makes these streaks visible (i). (j) Specimen bias effects are quantified through SNR and contrast. SNR was calculated as (Nm - Nc)/sqrt((Nm + Nc)/2), where Nm and Nc are electron counts of membrane and cytoplasm respectively. Contrast was calculated as (Nm - Nc)/((Nm + Nc)/2). Scale bar, 1 µm in (a), (b) and (g), 10 µm in (c) and (d), 500 nm in (e), (f) (h), and (i).

