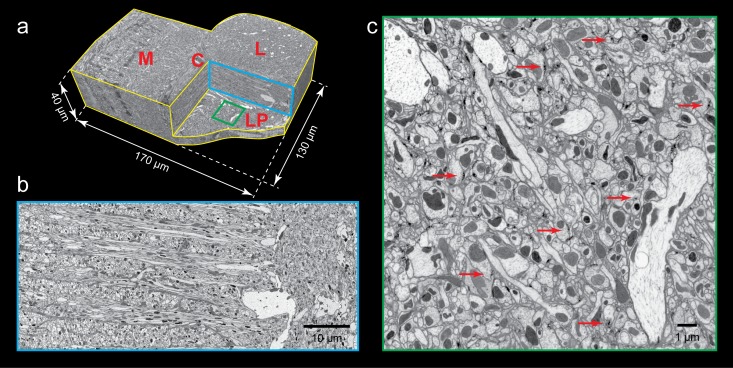
Figure 3. FIB-SEM images of Drosophila optic lobe.
(a) A cropped FIB-SEM volume showing medulla (M), lobula (L), lobula plate (LP), and chiasm (C). (b) An enlargement of the blue cross-section in (a) showing a re-sliced y-z plane. Scale bar, 10 µm. (c) An enlargement of the green box in (a) showing a re-sliced x-z plane where very fine neural processes are visible. Red arrows indicate synaptic structures. Scale bar, 1 µm.

