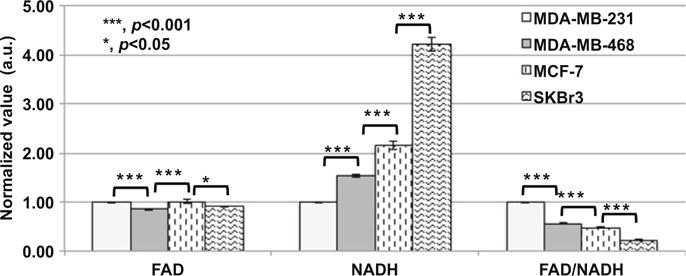
Fig. 16.2.

Normalized FAD, NADH, and FAD/NADH values of MDA-MB-231, MDA-MB-468, MCF-7, and SKBr3 breast cancer cell lines (three experiments at different days, duplicated dishes each time, with total number of FOVs = 24). There was 10 mM glucose in the imaging solutions of all groups. Bar height represents the mean and the error bar represents the SE
