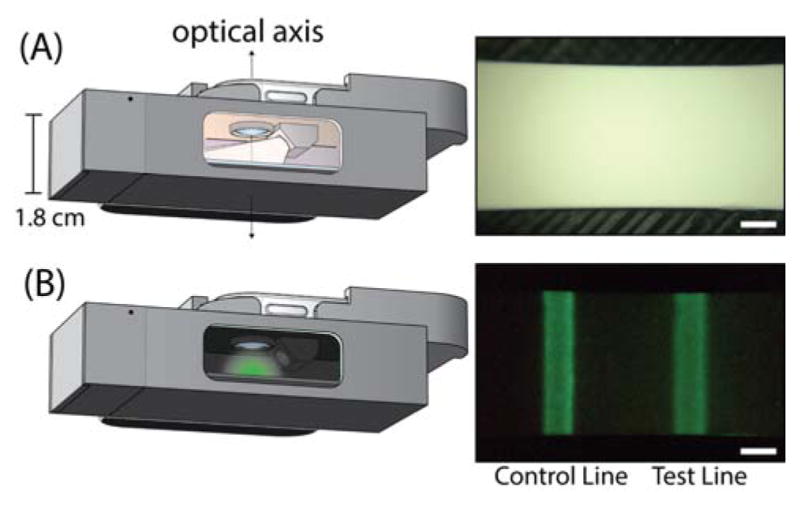
Figure 2.

Head-on view of the smartphone attachment on a phone with a cutaway to reveal the internal components and illustrate the time-gated imaging of an LFA strip (A) Left: phone’s rear camera flash turned on for photoexcitation of phosphors. Right: image of the result window during excitation by phone’s flash (B) Left: phone’s flash turned off for luminescence imaging. Right: image of luminescence from anti-hCG persistent nanophosphors bound at the test line and control line of the strip at an hCG concentration of 0.12 ng/mL hCG (scale bar = 1 mm).
