Figure 4.

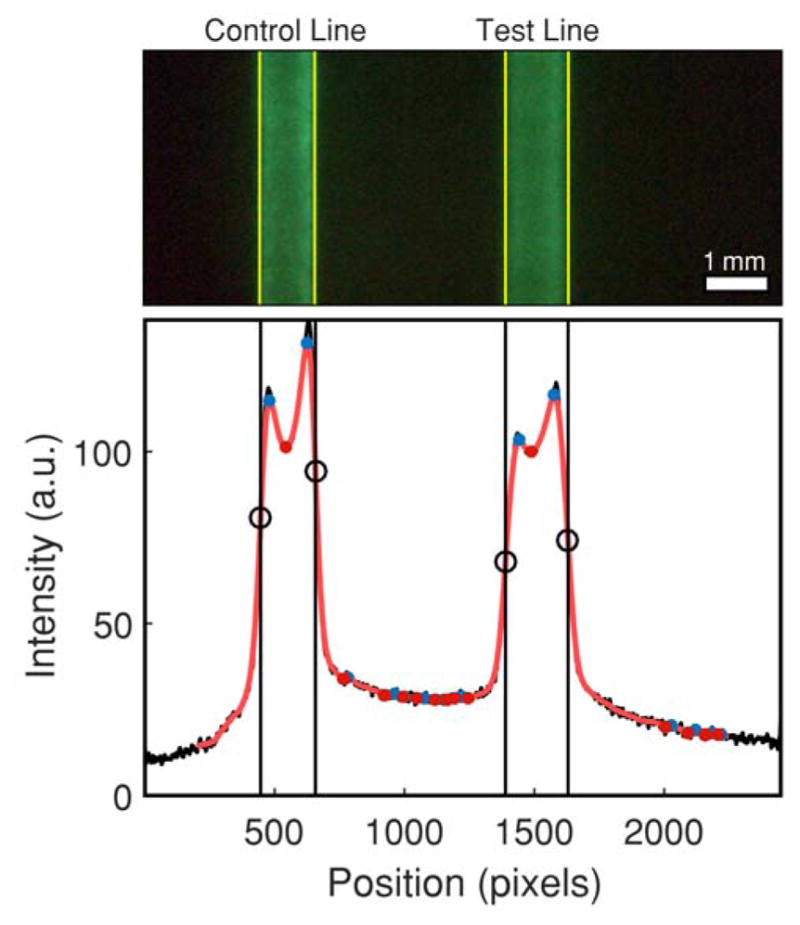
Pixel averaging method for LFA strip run with 0.3 ng/mL hCG. Black circles denote inflection points which correspond to the edges of the test and control lines, which are marked by yellow lines on the image of the strip.

Pixel averaging method for LFA strip run with 0.3 ng/mL hCG. Black circles denote inflection points which correspond to the edges of the test and control lines, which are marked by yellow lines on the image of the strip.