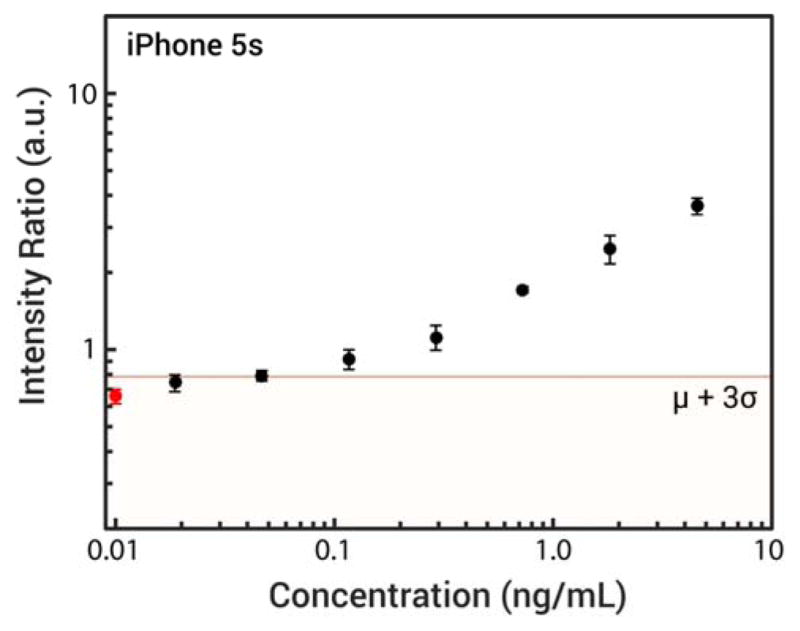
Figure 5.

Serial dilution of hCG detected with smartphone platform and strontium aluminate nanophosphors. The leftmost point on the plot, marked in red, corresponds to the mean and standard deviation of the blank samples. Horizontal line marks the mean of the blank plus three standard deviations.
