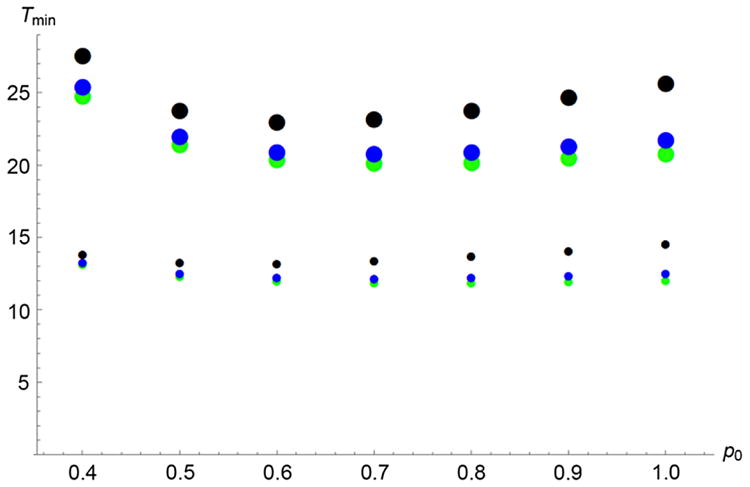
Fig. 7.

Time to reach about 80% (∼π/4) coverage as a function of initial frequency in the release area, p0. The calculations assume ρ p0 = 0.2, where ρ is the fraction of the target area over which releases occur. The small dots are produced with p̂ = 0.2; the large dots with p̂ = 0.3. Green points are for Gaussian dispersal, blue points for Laplace, and black for ExpSqrt.
